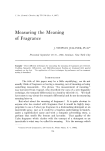
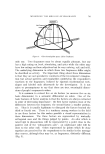
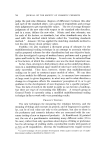
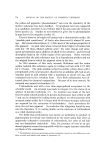
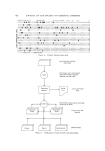
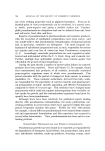
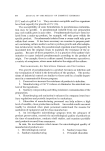
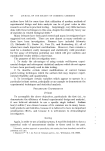
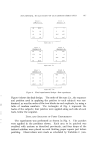
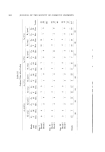
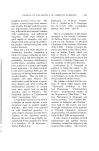
STATISTICAL EVALUATION OF CUTANEOUS IRRITANTS / / / / / / ¾' / / / so ø I I I I I 0 507 i 1695 2 2 386 0•/• •O/o 2Olo 4Olo •n Concen•rol,on + I Figure 7. Variable A. Plot of concentration effect. (Log linear portion significant at 0.01 level.) No significant curvature 827 variance. Because of the significant linear effect and the nonsignif- icance of higher effects, the visual fitting with a straight line was justified. Note, however, that the "linearity" is based upon logarithmic spacing of the four concentrations, with -+-1 added to keep all values positive. DISCUSSION AND CONCLUSIONS These experiments demonstrate three points which the authors believe are of great importance in irritation testing, and perhaps for patch testing in general, in addition to the specifics connected with the particular variables used. These are the following: (1) It appears possible with a properly designed experiment to obtain meaningful estimates of irritation on a scale of 0 to 4, to less than the nearest 0.50 scale unit. (2) Differences among subjects and among repetitions of experi- ments have always been regarded as a source of difficulty in irritation testing. This work demonstrates that it is possible, by using very well- known and commonly-used statistical techniques, to isolate completely the first of these sources of variation and to prevent their interference with differences sought among various experimental conditions. (3) The use of common multi-factor experimental techniques to- gether with appropriate statistical analyses appears practical and useful in studying patch test data.

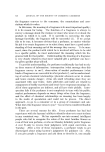
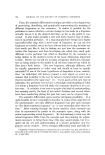
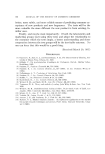
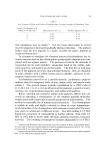
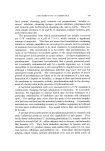
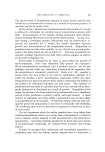
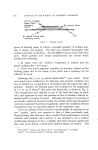
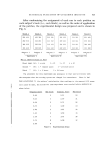
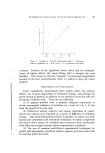
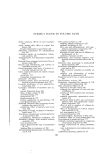
828 JOURNAL OF THE SOCIETY OF COSMETIC CHEMISTS '• 3o Figure 8. Variable B X C. • 6 2 pr,ss•re" Po•½h i i i 4 8 112 t6 210 •14 Elapsed Time After Removal of Palche*, Hours Plot of observation time X patch = type interaction. fieant at 0.05 level) (Signi- The more specific and less important conclusions to be drawn from this work are connected with the specific variables used. Discounting the first experiment except for the contact time variable, because of the relatively low significance levels obtained, and remembering that the analyses were of the kind known to statisticians as Type I (i.e., more or less limited to the particular levels of the variables and particular populations used), the following conclusions were drawn: (1) The increase of irritation with increasing concentration of sodium lauryl sulfate (within the range of concentrations tested) appears to be a logarithmic function, with the rate of increase of irritation decreas- ing as concentration increases. (2) The changes in observable irritation which occur after the patches are removed have not been emphasized in the literature. This work suggests that it is important to give the skin adequate time to develop a full irritation manifestation and to take this factor into account, especially in view of its interaction with the type of patch used. (3) The use of the "pressure" patch, as explained above, was meant not as a device to apply pressure per se, but as an attempt to determine whether normal minor variations in pressure under a patch affect the results, so that if so, means for controlling it and thus mini- mizing variation could be arranged. As this work shows, a relatively small increase in pressure was apparently very important, especially at certain observation times. This suggests that more study and experi-
Purchased for the exclusive use of nofirst nolast (unknown)
From: SCC Media Library & Resource Center (library.scconline.org)