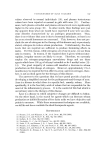
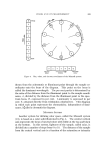
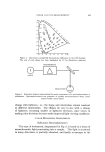
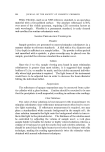
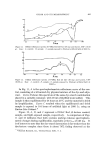
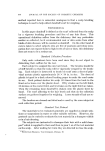
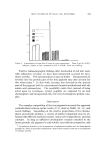
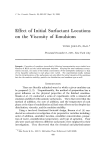
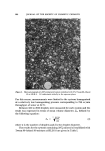
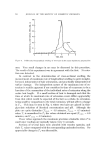
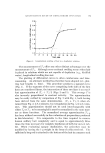
COLOR AND ITS MEASUREMENT 653 White Black 8 9 IO 1 2 3 5 .10 Figure Neutral • Saturated colour Chroma colour Hue, value, and chroma coordinates of the Munsell system drawn from the achromatic or illuminant point through the sample co- ordinates onto the locus of the diagram. This point on the locus is called the dominant wavelength. The per cent purity is determined by the ratio of the distance from the illuminant point to the sample coordi- nates, A, divided by the distance from the illuminant point to the spec- trum locus, B, expressed in per cent. Luminosity is expressed in per cent Y, obtained directly from tristimulus colorimeters. This diagram in which each point represents the chromaticity, independent of lumi- nance, ism, called a chromaticity diagram. MUNSELL SYSTEM Another system for defining color space, called the Munsell system (13), is based on a color solid illustrated in Fig. 4. The central vertical axis represents the locus of neutral colors with white at the top and black at the bottom. In this system, lightness of the sample, called value, is divided into a number of steps from 0 to 10. The distance of the sample from the central vertical axis is a function of the saturation or intensity

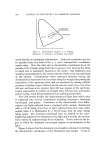
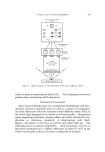
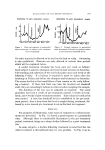
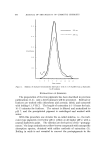
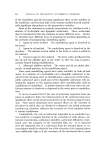
654 JOURNAL OF THE SOCIETY OF COSMETIC CHEMISTS of color and is called chrorna on the Munsell map. Chroma is also divided into a series of steps, with the neutral axis or gray being 0, whereas a fully saturated sample has a chroma of 12. Color, or hue as it is called in the Munsell system (14), is presented by different planes around the vertical axis of the Munsell solid. In this system, the whole solid is divided into ten equal vertical segments with five principal hues (red, yellow, green, blue, and purple) occupying the central planes of alternate segments while intermediate hues (yellow-red, green-yellow, blue-green, purple-blue and red-purple) occupy the remaining planes. Each hue segment is further divided into ten sections numbered 1 to 10, with the main hue segment always numbering 5. The hue of a sample is designated by a number, indicating the section of the segment, followed by symbols which show the color of the segment involved. For example, 10P indicates the hue section 10 of the purple segment. To complete the specification of the sample, the value quan- tity follows the hue which is then followed by a stroke and then the chroma. Here the color defined at 10 P •/• has the hue 10 P, the value 5, and the chroma of 8. COLOR DIFFERENCE AND TOLERANCE It is of interest to point out that color differences are not entirely linear throughout the entire CIE chromaticity diagram since, if one cal- culates two points on this diagram, another set of points twice as far apart do not necessarily have a totally linear difference in color (9, 15). In other words, equal distances on the diagram do not always indicate the same degree of color change. Judd (16) devised the Uniform Chromaticity Scale (UCS) adopted by the National Bureau of Standards (NBS). Adams (17) followed with his chromatic-value diagram which was accepted by the American Society for Testing Materials (ASTM). MacAdam (18) investigated color dif- ferences where the observer made a large number of matches on a series of test colors located at various points in the chromaticity diagram. The spread in the color settings necessary to make a match (Fig. 5) was used by MacAdam as the criterion of sensitivity to color differences. The distances from points on the boundary of each ellipse to the central point within the ellipse approximately correspond to the chromaticity difference just perceptible with certainty under specified viewing condi- tions this just perceptible color difference is defined as one MacAdam unit. The orientation of the major axis of individual ellipses is a func- tion of the dominant wavelength and purity changes, but does not
Purchased for the exclusive use of nofirst nolast (unknown)
From: SCC Media Library & Resource Center (library.scconline.org)