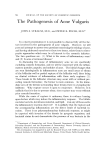
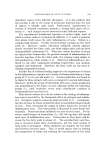
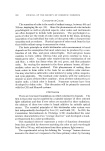
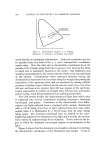
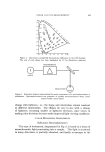
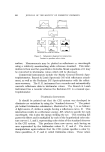
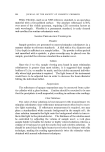
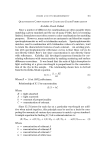
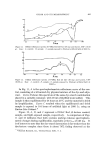
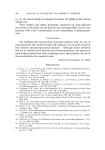
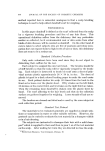
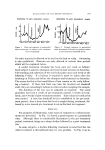
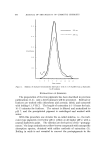
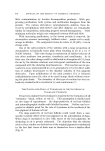
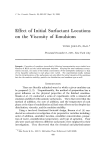
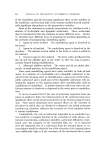
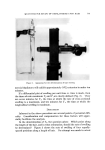
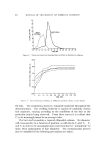
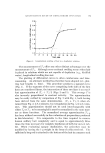
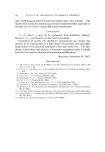
COLOR AND ITS MEASUREMENT 655 Y 1.s 52.• 530 •0 •'X •4• o.4- 499 • • •oo F•gure 5. MacAdam's perceptible chromaticity differences in the CIE diagram. The axis of each ellipse has been multiplied by 10 for illustrative purposes SOURCE MONOCHROMATOR PHOTO-SENSO MPLE Figure 6. Schematic diagram representing the major components of a spectrophotometer or colorimeter. Spectrophotometers use prismatic or grating monochrometers where colori- meters would contain filters change with lightness i.e., the shape and orientation remain constant at different luminosities. The ellipses do vary in size with a change of lightness, becoming smaller as lightness increases, since errors in making color decisions decrease under improved light-viewing conditions. COLOR MEASURING INSTRUMENTS Reflectance Spectrophotometers This type of instrument, diagrammed in Fig. 6, is based on a beam of monochromatic light penetrating into a sample. This light is scattered in many directions, is partially absorbed, and finally re-emerges to the

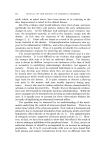
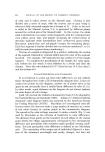
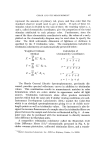
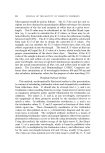
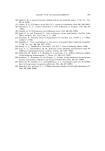
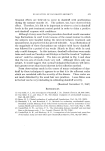
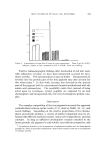
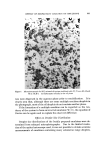
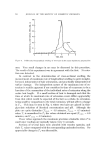
656 JOURNAL OF THE SOCIETY OF COSMETIC CHEMISTS 400 700 400 700 SAMPLE REFLECTANCE (R) SOURCE EMISSION (E) RxE SPECIFYING THE COLOR OF A SAMPLE Figure 7. Schematic diagram for interaction factors to produce color vision surface. Measurements may be plotted as reflectance rs. wavelength using a relatively nonabsorbing white reference standard. This infor- mation is then used for quantitative Kubelka-Munk equations or it may be converted to tristimulus values which will be discussed. Commercial instruments include the Hardy General Electric Spec- trophotometer, Bausch & Lomb Spectronic 505 with reflectance attach- ment, as well as the Beckman DU Spectrophotometer with the reflect- ance accessory. The G. E. instrument has a recorder and automatically converts reflectance data to tristimulus values. The Bausch & Lomb instrument has a recorder whereas the Beckman DU is a manual spec- trophotometer. Tristimulus Instruments It should be pointed out that the CIE system was developed to eliminate eye variations by using the "standard observer." The princi- ple behind tristimulus colorimeters, illustrated in Fig. 7, is as follows: A light source, E, strikes a sample having a reflectance curve, R. This interaction results in a reflectance energy, RE, which is specific for each wavelength this is also the energy striking the eye. This resulting RE passes the filters and is multiplied by each of the hypothetical color mix- ture curves oe, 9, and •, representing color vision of the standard observer in the CIE system. This produces three new curves, each having an area represented by the tristimulus values X, Y, and Z. The above manipulations again indicate that the CIE system specifies a color by three quantities, X, Y, and Z, called tristimulus values. These values
Purchased for the exclusive use of nofirst nolast (unknown)
From: SCC Media Library & Resource Center (library.scconline.org)