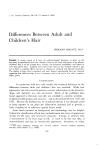
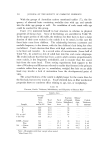
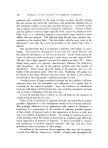
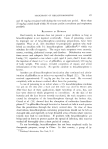
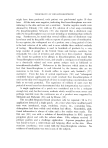
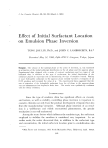
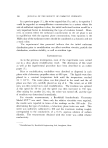
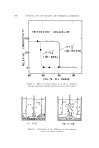
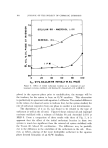
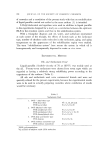
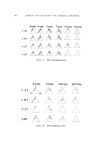
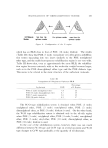
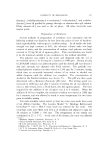
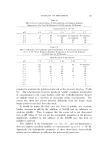
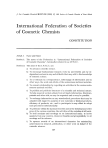
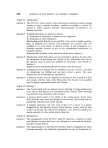
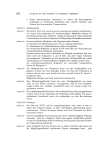
EMULSION PHASE [NVERSiO24 191 IOO 5o Fi,•ure 2. i I i TRITON X-IO0 - ARLACEL8:5 O/W • W/O .... I I I 85 90 95 VOL. % OIL PHASE Conductivity change at inversion point, 60% Triton X-100 initially in the aqueous phase observed that placing of the turbine near the vessel bottom tended to draw the oil phase downward to favor the formation of an O/W emulsion. Placing of the impeller near the upper liquid surface tended to pull the aqueous phase upward and thus encouraged the formation of a W/O emulsion as illustrated in Fig. 4. Since the main purpose of this work was to study the effect of the initial surfactant distribution, the clearance, H, was set at a constant value, ¬ in., and all physical variables were controlled very carefully to assure good reproducibility. In all cases, the surfactant systems used were mixtures of a lipophilic and a hydrophilic surfactant at HLB 8. The total surfactant concentration was kept at 1•'o. Since the lipophilic surfactants used had poor solubility in water, they were all dissolved in thc oil phase prior to emulsification. The hydrophilic surfactants were, on the other hand, divided between the oil phase and aqueous phase in different proportions.

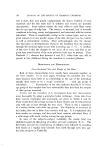
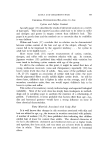
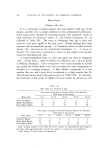
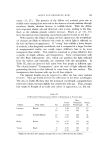
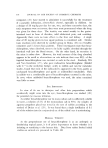
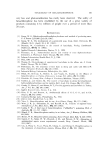
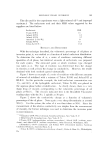
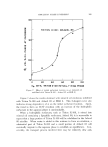
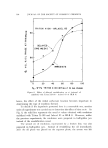
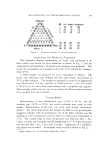
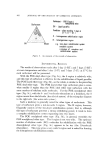
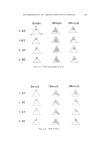
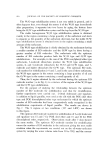
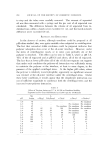
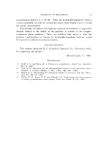
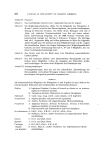
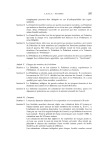
192 JOURNAl. OF THE SOCIETY OF COSMETIC CHEMISTS oo 50 O w 80 I I I TRITONX-IO0- ARLACEL 8:3 I ! I ,/.H--2 4 ! , ( • = 84%•) ! I I ! ! ß '0- -- -0 ...... ß I D"O ¸ 0 -- I t 85 90 95 VOL.% OIL PHASE Figure 3. Effect of mixer location on q• (H = clearance between the mixer impeller and the bottom of the vessel) ½)-.) H:¾ (B) H=..4 Figure 4. Illustration of the difference in flow pattern created by mixer location
Purchased for the exclusive use of nofirst nolast (unknown)
From: SCC Media Library & Resource Center (library.scconline.org)