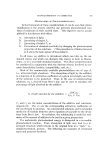
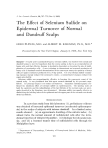
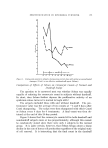
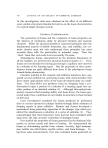
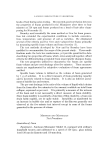
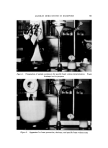
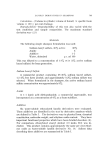
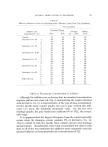
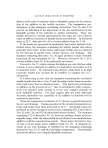
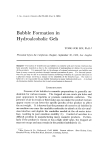
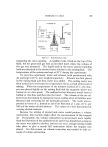
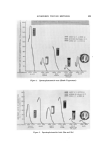
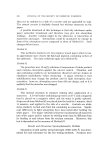
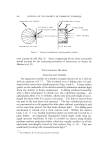
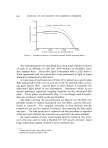
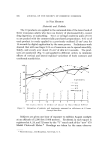
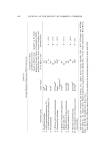
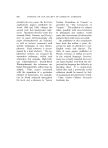
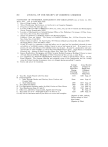
BUBBLES IN GELS 799 THERMOMETER BURET MAGNETIC Figure 2. Experimental setup regulating the valve opening. A capillary tube, fitted on the top of the flask, led the generated gas into an inverted buret where the volume of the gas was measured. The liquid used in the buret and the bubbling bath was identical to the alcohol-water solution in the mixing flask. The temperature of the system was kept at 23 øC during the experiments. To start the experiment, water and ethanol, both presaturated with air and kept at 23 øC, were weighed separately. Ethanol was first placed in the mixing flask and then water was added. The cooling water was then turned on to overcome the temperature rise as a result of the heat of mixing. When the temperature of the mixture reached 23 øC, the stop- per was placed tightly on the mixing flask and the magnetic stirrer was turned on at a low speed. The undissolved air liberated would start to bubble at this time and flow into the buret. The volume of the air col- lected was determined by taking the buret reading when all bubbles were liberated and correcting for the hydraulic pressure. The result was ex- pressed in terms of a, defined as ml of air liberated at 1 arm, 23 øC, per 100 g of the water-alcohol mixture. The values of a were determined at varying alcohol contents. Because the mixing of alcohol and water would produce a volume contraction, this reaction might affect the measurement of the trapped air. Fortunately, the volume contraction occurred much more rapidly than the liberation of the undissolved air and it was found that as long as the water was added to alcohol, and not vice versa, enough mixing would take place to give a nearly full contraction before the stopper was placed. For this reason, no volume correction was needed to take ac- count of volume contraction.

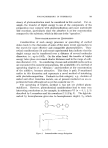
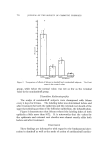
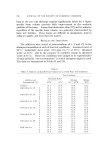
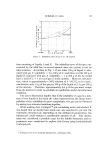
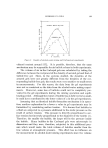
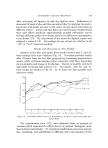
800 JOURNAL OF THE SOCIETY OF COSMETIC CHEMISTS Gel Experiments In the second series of experiments, hydroalcoholic Carpobol gels having various alcohol contents were prepared. Before forming a gel, Carbopol 940 resin was dispersed in the alcohol and the neutralizer was dissolved in the water. These solutions were then saturated with air by bubbling in air at 23 øC. A gel was then prepared by combining the two phases under carefully controlled mixing to avoid entrainment of any external air. The gel was kept in an enclosed jar and placed in a con- stant temperature bath at 23 øC for about 24 hours or until an equi- librium was reached. In the systems studied, it generally took about 2 minutes after gel formation before bubbles started to appear. Both the number and the size of bubbles increased slowly with time until a maximum was reached. This generally required several hours. When the density of the gel (in- eluding all air bubbles) reached a constant value, the system was con- sidered to have reached an equilibrium. The amount of air bubbles in the system was then calculated from the density of the aerated gel and the density of a corresponding bubble-free gel. The results were also expressed in terms of a, the volume occupied by the bubbles in ml at equilibrium per 100 g of gel at 23 øC. As in the alcohol-water mixing ex- periments, a was determined as a function of the ethanol content in the gel. Before taking samples for density measurements, the aerated gel was mixed completely to assure the uniformity of the bubbles in the gel samples. Two to four samples were taken from various locations of each gel system and the bubble distribution was considered uniform when the densities of the samples agreed well. RESULTS AND DISCUSSION The results of the alcohol-water mixing experiments are given in Fig. 3 by a solid line. Considering the difficulty in maintaining the system at a constant temperature and preventing bubble escape before the stop- per was placed, the data were fairly consistent and reproducible. Ac- cording to the curve, the amount of air released increases with the alcohol content to a maximum value and then starts to decrease as the mixture approaches pure alcohol. The results of the bubble formation in hydroalcoholic gels are also presented in the same graph by a broken line. Although these two curves do not coincide exactly, it is interesting to note that the shapes of the curves are very similar and both curves show maximum values at
Purchased for the exclusive use of nofirst nolast (unknown)
From: SCC Media Library & Resource Center (library.scconline.org)