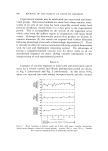
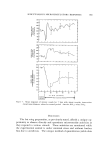
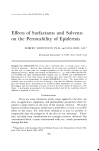
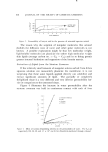
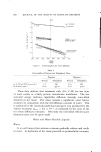
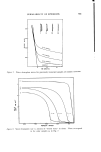
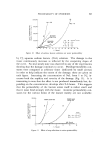
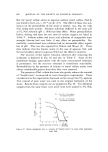
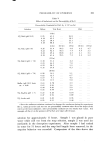
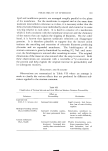
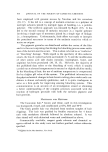
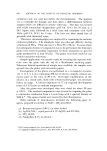
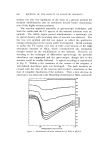
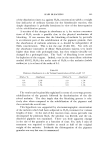
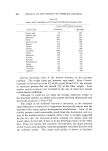
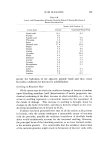
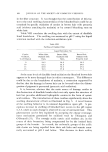
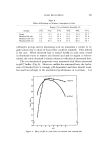
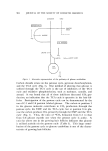
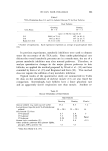
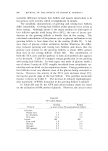
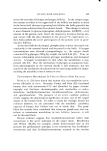
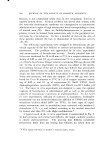
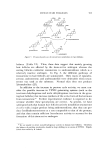
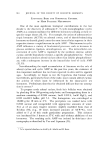
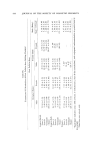
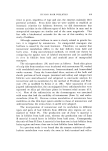
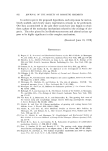
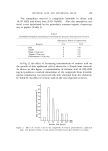
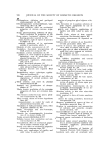
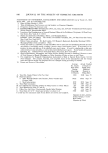
PERMEABILITY OF EPIDERMIS 861 2O[- FROM STEADY STATE ! FROM LAG TIME MEASUREMENTS "a t6 MEASUREMENTS • . .. o I I I I 0 24 48 72 96 Figure 6. Effect of water immersion on the permeability constant of water as a function ooe time rapidly at first and then much more slowly. The curve in Fig. 6 depicts the course of this increase for water and for other small water-miscible solutes which behave similarly. The curve is an idealized composite derived from both steady state measurements and measurements of "lag times." If the membrane diffusivity is increased by hydration, the ob- served lag time for diffusion will be larger than the theoretical value based on the final steady state diffusion constant r: •/6k v. (The lag time is roughly the time required to establish the final concentration gradient within the membrane after the solvent is first applied. It is obtained from the intercept of the curve which displays the amount of substance exiting a membrane as a function of time.) As shown in Table II, the observed lag times were in all cases much larger than those pre- dicted from the formula. Table II Permeability Constants and Lag Times for the Alcohols r (rain) r (min) kp •cm hr -- 1) Theoretical Observed Solute 25 øC 25 øC 25 øC H20 1.0 X 10 -7 Methanol 1.0 Ethanol 1.2 Propanol 1.4 Butanol 2.5 Pentanol 6.0 Hexanol 13.0 Heptanol 32 Octanol 52 15 15 12 5 10 8 6 2 1 0 0 0 5 2 48 28 40-120 40-120 40-120 20-100 20-100 20-100 5-20 5-20 5-20

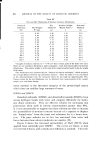
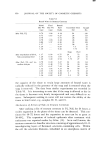
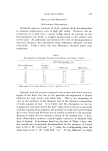
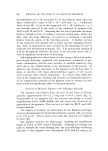
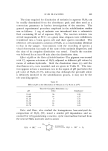
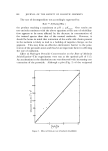
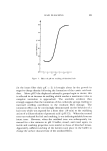
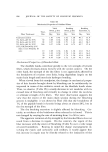
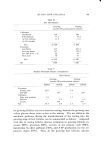
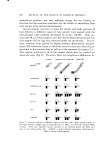
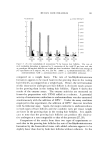
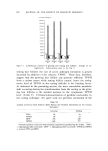
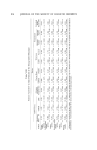
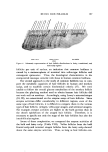
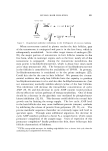
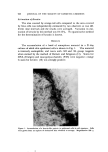
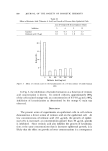
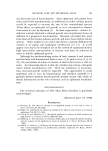
'862 JOURNAL OF THE SOCIETY OF COSMETIC CHEMISTS The two sets of values can be reconciled if the steady state k v • D/a, corresponding to the fully hydrated membrane, is gxeater than the initial kv corresponding to the dry membrane. Expansion of the mem- brane per se (a wet a dry) cannot account for the increased lag times since "bound water" measurements indicate that expansion is a slow process requiring many hours and even days. It thus appears likely that the diffusion constant per se increases rapidly during the initial hydra- tion of the tissue as depicted in Fig. 6. After about 2-3 days in water the tissue apparently reaches equilibrium as indicated by an unchanging permeability maintained for many days. The tissue remains reason- ably intact even after 2 weeks' immersion in water at 27øC and the activation energy for water permeation and for other water soluble nonelectrolytes remains high, e.g., 13-15 kcal/mole (8, 9). "Bound Water" Evidence for the slow hydration and expansion of stratum corneum is obtained by measuring the rate at which water is desorbed from samples of tissue which have been presoaked in water [or different periods. The large difference between the rate of diffusion of the "bound water" in the tissue and the rate of evaporation of the free sur- face water allows an accurate determination of the amount of expansion due to water inhibition. After the larger part of the free surface water has evaporated, the desorption rate decreases abruptly (Stage I -- II -- III in Fig. 7) from approximately 0.6 to 0.01-0.05 mg/min. The slowly changing part of the desorption (III -- IV) is limited by diffusion through the membrane. The significant fact is that this diffusion-limited stage involves very large amounts of "bound water" equivalent to many times the weight of the dry sample. This is shown more clearly in Fig. 8 where the rate of desorption [or the same set of samples is plotted against the percentage of water remaining in the sample. Data from several samples are collected in Table III. It can be seen that the hydration of the stratum corneum is a very slow process requiring sev- eral days before the maximum bound water content of 4-5 times the weight of the dry sample is attained. Samples which have been delipidized by thorough soaking in hexane, acetone or (2:1, C:M) behave like wet filter paper they do not re- rain more than a few per cent of bound water, e.g., curve D, Fig. 7 and 8. This is not due to the hydroscopicity of the removed lipids which bind very little water themselves. Rather, the presence of the lipids
Purchased for the exclusive use of nofirst nolast (unknown)
From: SCC Media Library & Resource Center (library.scconline.org)