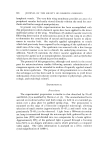
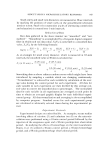
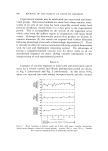
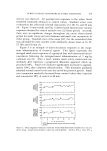
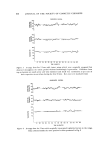
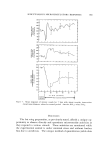
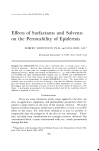
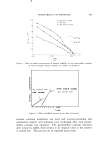
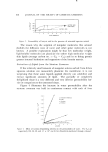
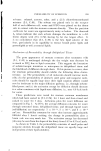
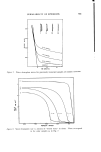
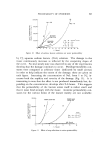
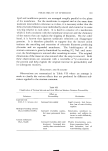
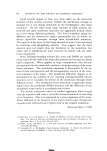
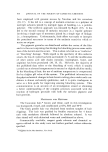
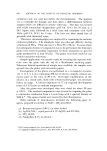
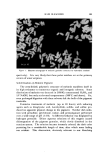
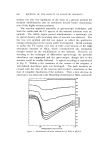
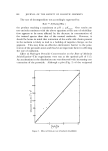
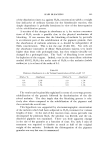
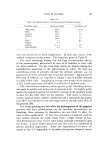
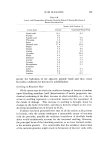
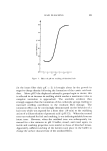
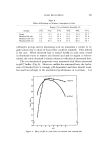
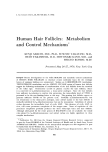
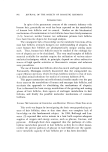
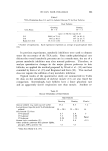
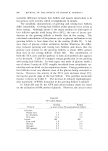
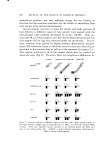
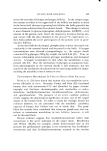
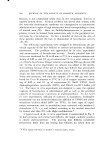
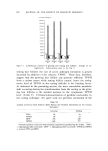
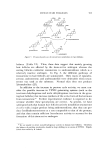
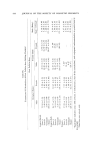
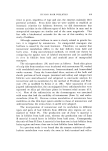
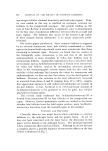
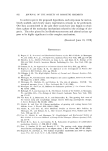
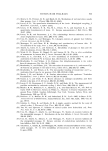
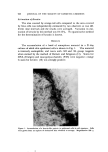
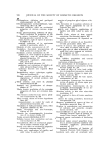
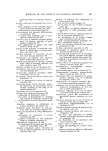
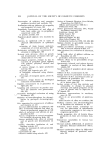
SUBCUTANEOUS MICROCIRCULATORY RESPONSES 849 activity was observed. All postinjection responses to the saline blank remained essentially identical to control values. Standard errors were ew, luated at the arbitrarily selected time points of 5, 20, 35, and 50 rain (6). Figure 3 (innervated) and Fig. 4 (denervated) demonstrate vascular responses obtained for control animals over a 2.5-hour period. As noted, there were no significant changes throughout the entire observational period for small artery and vein diameter and small vein vasomotion in either group. Standard error of the mean (S.E.) for the normalized data was calculated for each variable at the arbitrarily chosen times of 15, 45, la, 105, and 135 rain (7). Figure 5 is an example of microcirculatory responses to the exoge- nous administration of chemical agents. This figure represents the averaged small vessel responses of a group of bats with innervated micro- vasculature following the intraperitoneal administration of 3 mg/kg cadmium ion (6). After a brief, intense small artery constriction im- mediately aher injection, a progressive dilatation appeared which ap- proached 130%. Small vein diameter significantly increased to approxi- mately 130% after cadmium administration. This dilatation gradually subsided toward control levels near the end of the protocol period. Small vein vasomotion markedly decreased from control values after injection and re•nained at 50% of control at 60 min. m• ø 12ø l .......... -•'] • [o • 110.-[- 80l i i i i i [ i i i i •l • T I M E (minutes) • Control Period Post-injection Period Figure 2. Mean responscs of minute vessels for 4 bats with denervated vasculature in an area of one wing. Actual mean diameter valucs for control period: Arterics, 42.0 /• veins, 84.5 /•

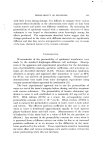
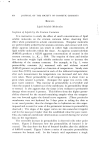
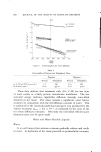
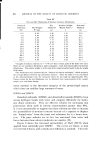
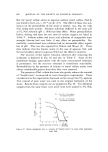
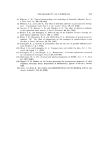
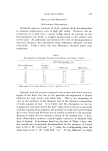
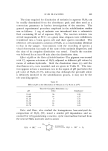
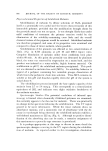
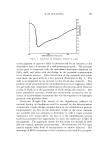
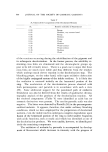
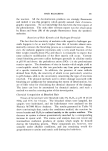
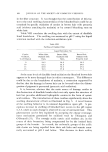
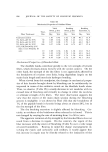
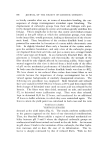
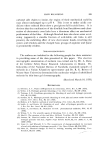
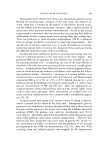
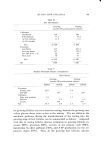
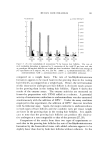
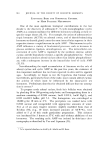
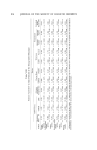
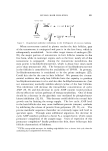
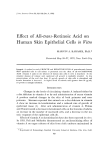
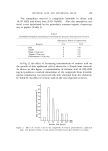
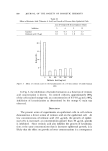
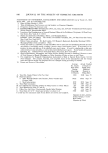
850 JOURNAL OF THE SOCIETY OF COSMETIC CHEMISTS •3o• r • 7o INNERVATED CONTROL t TIME N MINUTES Figure 3. Average data for 5 bats with intact wings which were surgically prepared but observed throughout the entire period without hemorrhagic hypotension. Ordinates from top to bottom are small artery and vein diameters and small vein vasomotion as per cent of their respective mcan values during the first 30 min. Bars represent standard errors DENERVATED CONTROL 130. so '701. 130. • IiO •.g 90 70• II0 t T -) 9ø t ) 7o [_ .... 'o4 10 20 50 40 5 0 70 80 • • HO •20 •5• m40 •50 TmME IN MINUTES Figure 4. Average data for 5 bats with surgically interrupted tcgmental nerves to the wings. Data collected under thc same protocol as data presented in Fig. 3
Purchased for the exclusive use of nofirst nolast (unknown)
From: SCC Media Library & Resource Center (library.scconline.org)