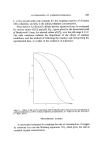
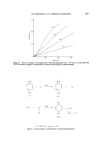
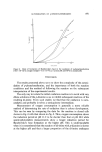
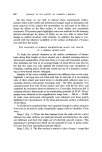
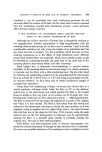
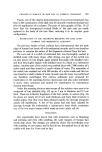
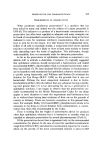
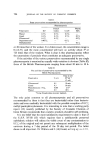
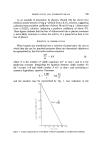
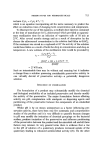
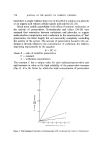
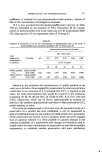
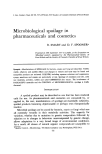
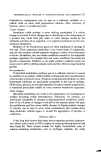
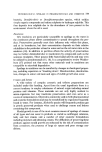
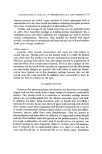
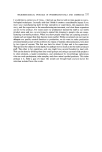
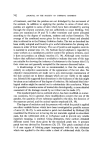
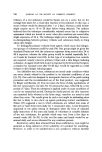
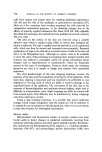
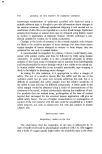
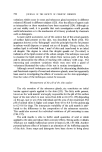
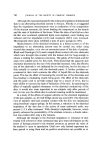
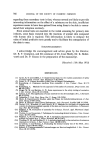
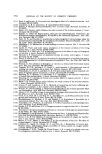
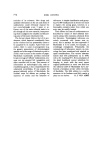
PRESERVATIVES FOR PHARMACEUTICALS 711 Log conch preservahve Figure 2. The concentration exponent of a preservative. some examples being shown in Table V and Table VI shows the theoretical change in activity with change in concentration for the preservative groups listed in Table V, and indicates that losses of preservatives of the order of 10•o may be of no significance and that even losses of up to 50• of Table V Concentration exponents of some commonly used preservatives Preservative n Preservative n Organomercurials 0.5 Chlorhexidine 2.0 Formaldehyde 1.0 Parabens 2.5 Quaternaries 1.0 Phenolics 6.0 Table VI Relationship between concentration exponent, change in concentration ' and change in activity Increase in killing time for concentration loss of: Concentration exponent 50 % 40 • 20 % 10 % 0.5 x 1.4 x 1.3 x 1.11 x 1.05 1.0 x 2 x 1.66 x 1.25 x 1.11 2.0 x 4 x 2.75 x 1.56 x 1.23 2.5 x 5.6 x 3.55 x 1.75 x 1.30 6.0 x64 x20.9 x 3.8 x 1.90

712 JOURNAL OF THE SOCIETY OF COSMETIC CHEMISTS organomercurials and quaternaries may not be of practical importance but 50•o loss of a phenolic can be very serious. Thus, when considering the loss of preservative from a solution, through no matter what cause, it is not sufficient to state the weight lost or percentage lost, but it is imperative that this information be linked with the concentration exponent because it is the loss of activity and not the loss in weight that is of concern. Preservative activity is influenced by temperature, the higher the ambient temperature the more active is the preservative. It is usual to relate preservative temperature to the death-rate constant by the expression 0(50: - 50x ) - K•. (Ill) Ki where 0 = temperature coefficient of the preservative Kx = death-rate constant at temperature Tx K,. = death-rate constant at temperature T1 and since by equation (II) Kx tz K2 tl 0(50,- 50•) - tx (IV) ß Thus, if the temperature coefficient of a preservative is known the change in sterilization time may be calculated for a stated temperature change. Unfortunately, temperature coefficients vary according to the temperature range over which they are measured and the test organism (19, 20). For the sake of an example, a representative 0 xø for phenol over the temperature range 10-20 ø would be 5.0 (0•ø=5-1.175øC -•) which means that at 20 • a solution of phenol would kill E. coli five times as fast as at l0 ø. It is sometimes useful to be able to predict the effect on preservative activity of changing both the concentration and the temperature of a pre- servative. If from equation (II) is abstracted C1 n re-arranged as Clntl = Cs": and this is combined with equation (IV) re-arranged as tl = t2 0(50:-501)
Purchased for the exclusive use of nofirst nolast (unknown)
From: SCC Media Library & Resource Center (library.scconline.org)