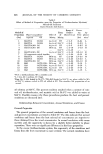
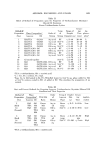
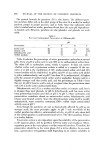
AEROSOL EMULSIONS AND FOAMS 625 ably different stabilities. One had a 50% excess of myristic acid, the other, a 50% excess of triethanolamine. Previous work had shown that aerosol emul- sions with the excess of myristic acid were far more stable than those with an excess of triethanolamine (1). The stoichiometric concentration of tri- ethanolamine myristate in the aqueous phase was 0.20M. The total weight per cent concentration of the surfactant portion, including the excess acid or base, was about 10%. The final emulsion had a composition of 90% aqueous phase and 10% mineral off. Each of the two concentrates was prepared by 14 procedures. The different methods of preparation involved such variations as the distribution of tri- ethanolamine and myristic acid between the oil and aqueous phases, the temperature of the aqueous phase, and the order of addition of the two phases, i.e., oil to aqueous or aqueous to oil. When the mineral oil and myris- tic acid were combined, the mixture was kept at 54.4øC to keep the myristic acid in solution. Details of the variations in the methods of preparation are given later in Tables I and II. The oil and aqueous phases were added slowly to each other with stirring. After addition was complete, the emulsions were stirred for an additional 25 min at room temperature. In preparations where the aqueous phase was heated, the emulsions were cooled to room temperature after mixing and the emulsions then stirred an additional 25 min. The emulsions were poured into screw-capped bottles and shaken 20 times. Samples were placed on slides for photomicrographs and the bottles set aside for creaming measurements ( phase separation determinations ). Aerosol Emulsions Aerosol emulsions for stability studies were prepared by loading the con- centrate into a 4-oz glass bottle, purging, and capping with a standard valve. The propellant was pressure loaded. The aerosols had a composition of 90% aqueous concentrate and 10% Freon© 12/Freon©* 114 (40/60). The aerosols for photomicrographs were prepared by loading the concen- trate into a 4-oz bottle, purging, and capping with a valve drilled to a dia- meter of 0.080 in. One end of a glass pressure cell was attached to the drilled valve and the other end connected to a standard valve. The propellant was pressure loaded through the standard valve. The glass cell and procedure for loading the propellant have been described in detail in a previous publica- tion (1). After the propellant had been loaded, the aerosol was shaken 20 times and allowed to stand 24 hours before further testing. The bottle was then shaken 20 times and 5% of the product was discharged before taking photomicrographs to eliminate residual propellant remaining in the cell and dip tubes after pressure loading. *Registered trademark of E. I. du Pont de Nemours & Co., Inc., Wilmington, Del. 19898.

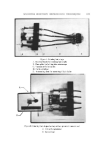
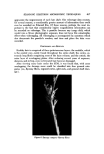
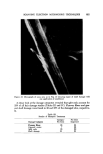
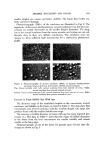
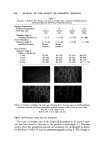
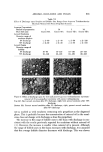
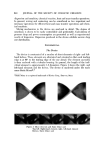
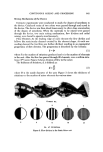
626 JOURNAL OF THE SOCIETY OF COSMETIC CHEMISTS Evaluation o[ Emulsions and Foams Microscopic Observations Photomicrographs of the mineral oil concentrates were obtained with a standard Bausch and Lomb monocular dynoptic model equipped with a mi- croipso viewing attachment and a 31/4 x 4V4 Leitz Polaroid camera. The emul- sions were placed on a slide with a cover glass. Photomicrographs were taken at a magnification of 150x using a 15x eyepiece and a 10x obiective. Type 52 Polaroid 4 x 5 Land Film was used with a 15-sec exposure time. The light source was an American Optical Corp. Model 651 illuminator.* The diameters of the emulsified droplets on the photomicrograph were esti- mated with a scale prepared by photographing a stage micrometer at the same magnification as that for the emulsions. The scale was calibrated in in- tervals of 10/x. Diameters down to about 2/x could be estimated. Droplets with diameters less than 2/x could be detected but not measured with any accuracy. Edmundson (3) reported that 1-2 /x was the smallest diameter of a particle that could be measured with any precision. The variation in droplet size is reported by the range of diameters between the largest and smallest droplets. To obtain the range of diameters of the emulsion droplets, the field under the microscope was scanned until the larg- est droplet was found. This portion of the field was photographed. The diame- ter of the largest droplet was measured and that of the smallest was estimated. It must be emphasized that the diameter range has no particular relationship to average droplet size. However, when combined with observations of the photomicrographs and the emulsion creaming times, the diameter range as- sumes significance as far as emulsion quality is concerned. The same tech- nique was used for foam bubbles. The aerosol emulsions were photographed in the pressure cell described in a previous publication (1). Photomicrographs were taken at 300x with a 15x eye piece and a 20x long-range objective. The emulsions were very opaque, particularly those with excess myristic acid. Even the very strong light source usedt did not give sufficient light transmission for distinct photo- micrographs of the excess myristic acid emulsions. As a result, the diameters of the droplets were only estimated. The light transmission was sufficient to obtain satisfactory photomicrographs of the emulsions with excess triethanola- mine. Aerosol foams were photographed at 150x using the technique reported earlier (1). Augsburger and Shangraw reported a method for bubble size analysis based upon photomicrographs of aerosol foams (4). øAmerican Optical Corp., Buffalo, N.Y. ?Professional Illumination Model PR-27, Bausch & Lomb, Inc., Rochester, N.Y.
Purchased for the exclusive use of nofirst nolast (unknown)
From: SCC Media Library & Resource Center (library.scconline.org)