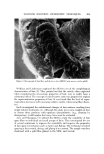
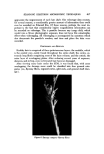
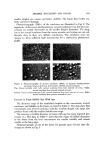
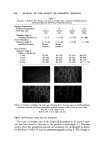
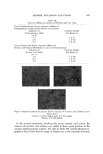
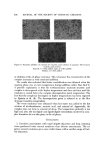
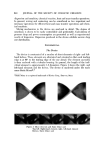
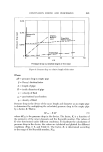
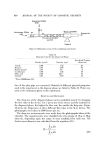
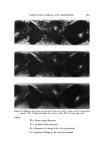
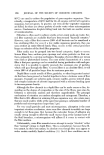
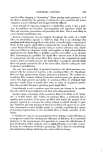
AEROSOL EMULSIONS AND FOAMS Table VI Ellect of Discharge upon Droplet and Bubble Size Ranges from Aqueous Triethanolamine Myristate / Mineral Oil / Freon Propellant Systems Aqueous Concentrate Method of preparation 1 14 1 14 TEA/MA ratio Excess MA Excess MA Excess TEA Excess TEA Aerosol Emulsions l)iameter range of emulsion droplets 5% discharge 2-40 2-40 2-80 2-120 75% discharge 2-30 2-30 2-60 2-110 Aerosol Foams Diameter range of bubbles 5% discharge 10-80 10-115 15-140 20-175 75% discharge 10-140 10-125 10-180 20-225 Figure 4. Effect of discharge upon the best and poorest aqueous triethanolamine myristate/ mineral oil/Freon propellant emulsions with excess triethanolamine Top left. Best aerosol enmlsion after 5% discharge right, best aerosol enmlsion after 75% discharge Bottom left. Poorest aerosol emulsion after 5% discharge right, poorest aerosol emulsion after 75% discharge not as marked as with emulsions containing only propellant as the dispersed phase. This is probably because the concentration of mineral oil in the emul- sions does not change with discharge as does the propellant. The increase in the range of bubble sizes in the foam with discharge is con- sistent with the results previously reported for emulsions without mineral oil (1). However, the increase is smaller when mineral oil is present. Although the range of bubble sizes in the foams increases with discharge, it is assumed that the average bubble diameter decreases with discharge. This was shown

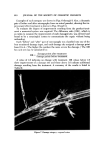
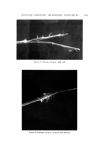
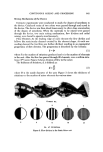
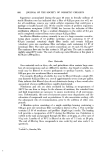
634 JOURNAL OF THE SOCIETY OF COSMETIC CHEMISTS to be the case with aerosol emulsions and foams when no mineral oil was present (1). DISCUSSION The present investigation, as well as that reported earlier (1), shows that a definite relationship exists between the properties of the concentrate, the aero- sol emulsion, and the foam when the surfactant is triethanolamine myristate. To what extent this relationship occurs with other surfactant systems remains to be determined. The apparent inconsistencies reported for nonionic aerosol systems should be clarified. The preferred method for preparing the mineral oil emulsions is to add the aqueous triethanolamine solution at room temperature to the mineral oil/my- ristic acid solution at 54.4øC. A possible explanation for the ei•iciency of this method is that triethanolamine myristate/myristic acid complex formation is promoted during the initial stages of emulsii•cation. Previous work had shown that the presence of the complex in an emulsion resulted in increased emul- sion stability and a smaller droplet size (1, 5). When the aqueous phase is added to the oil phase, initially the concentra- tion of myristic acid in the emulsion exceeds that of the triethanolamine. This favors complex formation. In the system with excess myristic acid, the myris- tic acid remains at a higher molar concentration throughout the addition of triethanolaminc. Complex formation is thus promoted at all times. In the sys- tem with excess triethanolamine, the myristic acid is at a higher concentra- tion than the triethanolamine during the initial stages of the addition of the aqueous phases. Ultimately, the concentration of triethanolamine exceeds that of the myristic acid as addition continues. When this point is reached, com- plex formation is no longer favored. On the other hand, consider the situation when the oil phase containing myristic acid is added to the aqueous triethanolamine solution. Initially, com- plex formation is not favored because the triethanolamine is at a higher con- centration than the myristic acid. In the system with excess triethanolamine, the latter remains at a higher concentration than the myristic acid through- out the addition of the oil phase and complex formation is never favored. In the system with excess myristic acid, complex formation is ultimately favored only when the concentration of myristic acid exceeds that of triethanolamine. In order to test this theory, two experiments were carried ont. In the first, involving the excess triethanolamine system, the aqueous triethanolamine was added stepwise in three equal portions to the mineral oil/myristic acid solu- tion. Photomicrographs were obtained after each addition. The data in Table VII and the photomicrographs in Fig. 5 show that the emulsion's droplet size range increases as the concentration of triethanolamine in the emulsion in- creases. This is because complex formation is less favored as addition con- tinues.
Purchased for the exclusive use of nofirst nolast (unknown)
From: SCC Media Library & Resource Center (library.scconline.org)