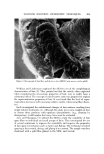
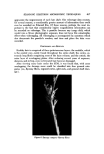
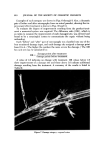
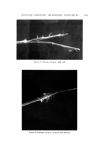
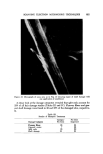
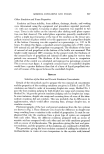
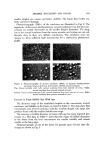
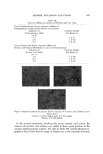
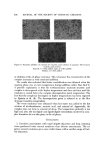
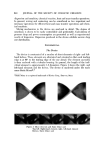
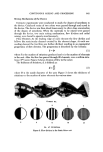
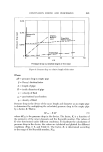
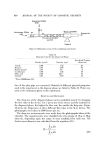
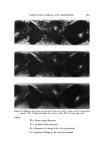
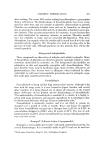
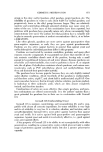
AEROSOL EMULSIONS AND FOAMS 69.7 Other Emulsion and Foam Properties Emulsion and foam stability, foam stiffness, drainage, density, and wetting were determined using the equipment and procedures reported previously (1) with one exception. Creaming or phase separation was reported in two ways. Times in the tables are the intervals after shaking until phase separa- tion was first observed. The initial phase separation generally manifested it- self by a slight layer formation at the top of the emulsion as the denser pro- pellant/mineral oil phase settled or by the appearance of a propellant droplet at the bottom. Creaming was also reported as a percentage, i.e., 1.5% in 24 hours. To obtain this figure, a standard aerosol consisting only of 80% water, 10% mineral oil, and 10% propellant was prepared. The thickness of the layer of mineral oil and propellant at the bottom of the bottle was measured. This height would represent 100% creaming. In the present work, the thickness of the creamed layer of propellant and mineral oil after aging for various time periods was measured. The thickness of the creamed layer in comparison with that of the control was calculated and expressed as percentage creamed. This is not an exact figure. A completely creamed layer of emulsified droplets would have a greater thickness than that of a layer of liquid propellant/min- eral oil because of the spaces between the emulsified droplets. •.]•SU'LTS Selection of the Best and Poorest Emulsion Concentrates Details of the 14 methods used to prepare the two mineral oil concentrates and the properties of the resulting emulsions are given in Tables I and II. The emulsions are listed in order of increasing droplet size range. Method No. 1 gave the best emulsion judging by both droplet size range and creaming time. Method No. 14 gave the poorest emulsion judging only by droplet size range. In some instances, droplet size range and creaming times of some of the inter- mediate emulsions did not correlate. This was probably due to differences in agglomeration, which would affect creaming time, average droplet size, or emulsion viscosity. Photomicrographs of the best and poorest emulsions from the two systems are shown in Fig. 1. These illustrate very clearly the difference in droplet size range resulting from a variation in the method of preparation. It must be em- phasized that only the emulsions from a given type of system are compared with each other. Thus, the different emulsions prepared with an excess of myristic acid are compared with each other and not with emulsions prepared with an excess of triethanolamine. The procedures giving the best and poor- est emulsions, and the properties of the emulsions, are condensed in Table III. The procedure giving the best emulsion consisted of adding the solution of triethanolamine in water at room temperature to the myristic acid/mineral

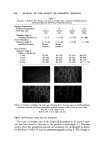
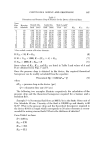
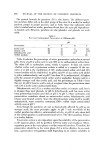
698 JOURNAL OF THE SOCIETY OF COSMETIC CHEMISTS Table I Effect of Method of Preparation upon the Properties of Triethanolamine Myristate/ Mineral Oil Emulsions Excess Myristic Acid System Range of Cream- Method of Temp Droplet ing Ag- Preparation Phase Composition a Order of of Diameters (/•) Time glomer- (No,) Aqueous Oil Mixing Mixing (hrs) ation • 1 H•O,TEA Oil, MA Aq. to oil RT 2-5 8-24 L 2 H20,TEA Oil, MA Aq. to oil 54.4øC 2-5 2-2.5 L 3 H20,TEA,MA Oil Aq. to oil RT 2-5 2-2.5 H 4 H•O,TEA,MA Oil Oil to aq. RT 2-10 1-1.5 H 50 . ..... 54.4øC 2-10 ... 6 H•O,TEA,MA 0ii Aq. tooil 54.4øC 2-15 0.•"1.0 H 7 All components mixed together 54.4øC 2-20 6-16 M 8 H•O,TEA Oil, MA Oil to aq. RT 2-20 1.5-2.0 M 9 H•O,TEA Oil,MA Oil to aq. 54.4øC 2-20 1.5-2.0 L 10 H•O,TEA, MA Oil Oilto aq. 54.4øC 2-20 0.5-1.0 H 11 H20 Oil,TEA,MA Oil to aq. RT 2-25 5-16 L 12 H, Oil,TEA,MA Aq. to oil 54.4øC % 2-25 3-16 L 13 H20 Oil,TEA,MA Aq. to oil RT 2-25 5-16 L 14 H20 Oil,TEA,MA Oilto aq. 54.4øC 2-35 3-16 L •TEA -- triethanolamine, MA = myristic acid. •L = low, M = medium, H -- high. •Prep. No. 5: MA heated to 54.4øC TEA, H, heated to 54.4øC aq. phase added to MA at 54.4øC mixture cooled to RT oil added at RT. This simulates the preparation of an aerosol. oil solution at 54.4øC. The poorest emulsion resulted when a mixture of min- eral oil, triethanolamine, and myristic acid at 54.4øC was added to water at 54.4øC. Possible reasons why these procedures produce the best and poorest emulsions are discussed later. Relationships Between Concentrates, Aerosol Emulsions, and Foa• General Properties The general properties of the aerosol emulsions and foams from the best and poorest concentrates are listed in Table IV. The data indicate that aerosol emulsions and foams from the best mineral oil concentrates are superior to those obtained from the worst concentrates. In aerosol emulsions with excess myristic acid, the superiority is shown by a slightly better stability to phase separation. There were no significant differences in the foam properties. In the excess triethanolamine system, the superiority of the emulsions and foams from the best concentrate is more evident. The aerosol emulsions have
Purchased for the exclusive use of nofirst nolast (unknown)
From: SCC Media Library & Resource Center (library.scconline.org)