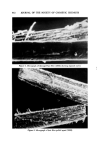
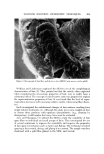
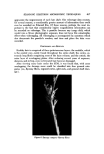
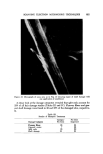
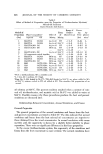
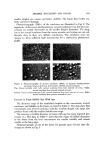
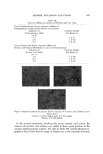
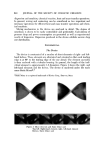
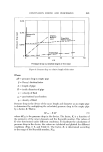
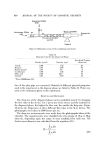
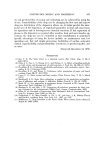
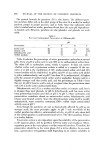
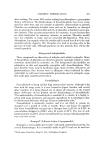
630 JOURNAL OF THE SOCIETY OF COSMETIC CHEMISTS Figure 1. Photomicrographs of the best and poorest aqueous triethanolamine myristate- mineral oil emulsions Top. Excess myristic acid. Left, best (procedure No. 1) right, poorest (procedure No. 14) Bottom. Excess triethanolamine. Left, best (procedure No. 1) right, poorest (procedure No. 14) Table IV Properties of Aqueous Triethanolamine Myristate/ Mineral Oil/Freon 12/Freon 114 (40/60) Emulsions and Foams Concentrate Properties Method of preparation TEA/MA ratio Oil droplet size (t•) Aerosol Properties Emulsion droplet size (t•) Emulsion stability and % phase separation Foam stability Stiffness (g) Wetting % drainage 15 min 30 min I 14 I 14 Excess Excess Excess Excess MA MA TEA TEA 2-5 2-35 2-40 15-190 2-40 2-40 2-80 (?) (?) 0% in 0% in 60--90 8 hrs 8 hrs rain 1.5% in 15% in 100% in 24 hrs 24 hrs 2.5 hrs 8 hrs 8 hrs 3.5-4 hrs 50 46 20 8hrs 8hrs lmin 2--120 100% in 15--30 rain lhr 18 i rain 0 0 6 83 0 0 48 78

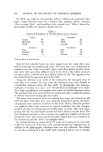
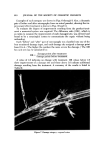
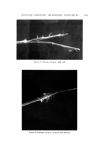
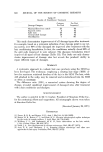
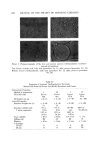
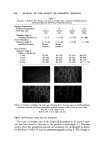
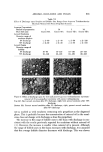
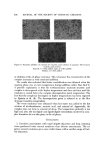
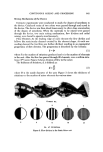
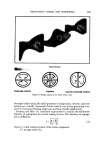
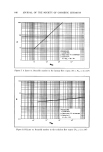
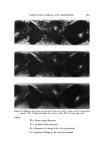
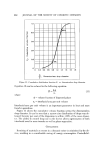
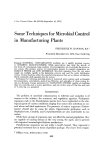
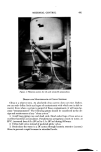
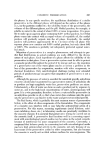
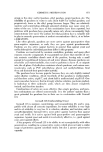
AEROSOL EMULSIONS AND FOAMS 631 smaller droplet size ranges and better stability. The foams have better sta- bility and lower drainage. Photomicrographs (300x) of the emulsions are illustrated in Fig. 2. The superio•'ity of the excess triethanolamine aerosol emulsions from the best con- centrate are readily discernible by the smaller drop!et diameters. The drop- lets in the aerosol emulsions from the excess myristic acid system are not suf- ficiently clear to draw any definite conclusions. The emulsions were too opaque to allow sufficient light transmission for a satisfactory photomicro- graph. •.• •. ? , • ... lip . •' .. ..•: :. ... .. , ß .... :. •.. ,. .. .:% •. ..,.::• .•.' ¾'•7P2:'•'•.., •..•:.'•.'.. •'* "•' '. ...... -. '_ ..•..•...:..•:'.•... :".•:' • t%. •:..... Figure 2. Photomicrographs of aerosol emulsions (300X) of aqueous triethanolamine myristate/mineral oil / Freon 12 / Freon114 (40 / 60) aerosol emulsions Top. Excess myristic acid. Left, aerosol emulsion from best mineral oil conc. Right, aerosol emulsion from poorest mineral oil conc. I•ottom. Excess triethanolamine. Left, aerosol emulsion from best mineral off conc. Right, aerosol emulsion from poorest mineral oil conc. Increase in Foam Bubble Size With Age The diameter range of the emulsified droplets in the concentrate, aerosol emulsions, and bubbles in the foams are listed in Table V. The data show that concentrates and aerosol emulsions with the smallest droplet size range also produce foams with the smallest bubble size range. The increase in bubble diameter in foams with age has been reported pre- viously (1). The data in Table V show that the range of bubble diameters in the foams from the best concentrates are smaller initially and remain smaller as the foam ages. Photomicrographs of one of the foams for periods up to 10 min after dis- charge are shown in Fig. 3.
Purchased for the exclusive use of nofirst nolast (unknown)
From: SCC Media Library & Resource Center (library.scconline.org)