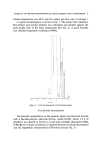
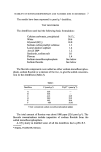
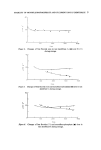
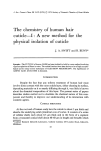
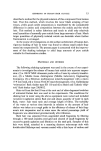
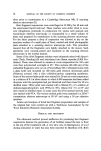
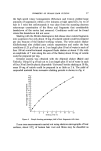
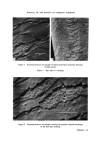
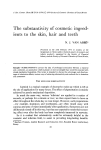
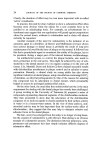
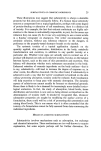
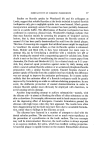
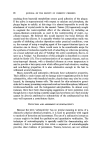
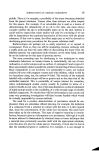
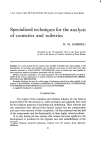
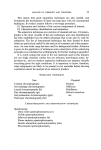
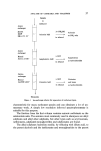
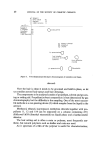
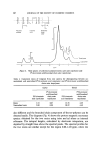
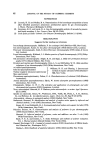
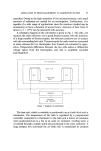
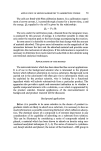
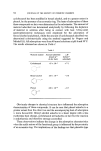
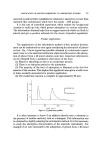
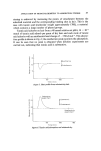
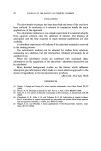
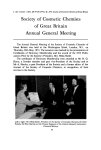
STABILITY OF MONOFLUOROPHOSPHATE AND FLUORIDE IONS IN DENTIFRICE 5 column temperature was 60øC and the carrier gas flow rate 15 ml min 4. A typical chromatogram is shown in Fig. 1. The molar ratio trimethyl- fiuorosilane and normal pentane was calculated and plotted against the peak height ratio of the same components (see Fig. 2). A good linearity was obtained (regression coefficient 0.9998). 6 5 4 3 Minutes Figure 1. GLC chromatogram of the benzene phase. Free fluoride determination The fluoride concentration in the aqueous phase was measured directly with a fluoride-selective electrode (Orion, model 94-09). About 1.0 g of dentifrice was diluted to 50 ml in a total ionic strength adjustment buffer (TISAB) (5). A linear correlation is obtained between the electrode potential and the logarithmic concentration of fluoride ions (see Fig. 3).

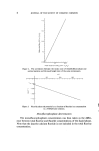
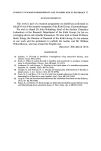
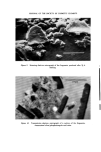
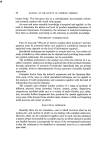
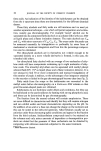
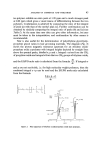
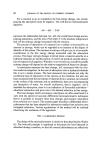
6 JOURNAL OF THE SOCIETY OF COSMETIC CHEMISTS 4o 3,0 O.C L Peak height ratio (Me 3 SiF'/n-C 5 H•2) Figure 2. The correlation between the molar ratio of trimethylfluorosilane and normal pentane and the peak height ratio of the same components. mV I I I 50 I00 150 ß I I I I I I I I I I I I I I I I I I l -4O Figure 3. Fluoride electrode potential as a function of fluoride ion concentration in a TISAB-water solution. Monofiuorophosphate determination The monofluorophosphate concentration was then taken as the differ- ence between total fluorine and fluoride concentrations of the liquid phase. Note that the inactive calcium fluoride is not included in the total fluorine concentration.
Purchased for the exclusive use of nofirst nolast (unknown)
From: SCC Media Library & Resource Center (library.scconline.org)