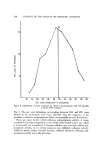
140 JOURNAL OF THE SOCIETY OF COSMETIC CHEMISTS The third type is based on gravimetric determinations of sweat output over relatively long time intervals. Procedures of this type are as a rule based on the procedure of Fredell and Read (6) and Daley (7). The procedure of this type reported by Wooding (8) presents in some detail the procedure we em- ploy. In our procedure the panelists are required to abstain from the use of all antiperspirant materials for at last one week prior to initiation of the study and throughout the study if it is a cross-over design. The sweat collections are carried out in controlled temperature rooms, 100 ---2*F and at about 35% relative humidity. Sweat collections are made during two successive 20- min periods using tared Webril©* pads. These collections are preceded by a 40-rain conditioning period in the hot room during which the panelists hold unweighed Webril pads in their axillae. In early attempts to carry out evalua- tions by this procedure, attempts were made to utilize data obtained during the periods immediately following the panelists' entry into the hot room. Ex- treme variations in sweating patterns of the panelists were encountered dur- ing the first 20-min period. Values were somewhat more reproducible during the period 20-40 min following the panelists' entry into the hot room how- ever, excessive variations in sweating patterns were still observed in some panelists. In essentially all hot room studies we have carried out during the past 10 years, sweat collections have been restricted to the period 40-80 min following panelists' entry into the hot room. We will present data which show that sweat collection data obtained during two successive 20-min collection periods, 40-60 and 60-80 minutes after hot room entry, are adequately re- producible to provide the basis for precise evaluation of antiperspirant ac- tivity. For convenience of reference, these collections will be referred to as Collections B and C. DATA EVALUATION M•.TUODS There is disagreement between investigators as to the evaluation procedure which should be applied to data obtained by various procedures. Our expe- riences indicate that the most consistent characteristic of individual sweating patterns is the ratio of sweat output by the two axillae of each individual. We have assembled sweating data from individual panelists in a series of several randomly selected studies. These studies varied from studies covering 10 days to some which encompassed 16 calendar weeks. Studies which cover longer time intervals are of multiple cross-over types. In these cases a 2-week recovery period always elapsed between test weeks. The accuracy of estimations of antiperspirant activity can be no more ac- curate than accuracy and reproducibility of data from the panelists utilized in the study. *Kendall Co., Walpole, Mass.

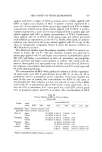
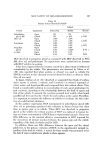
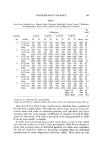
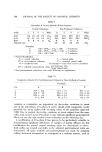
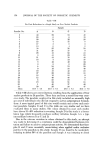
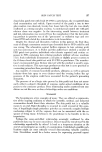
ANTIPERSPIRANT EFFICACY 141 Table I Data oerom Panelists in a Recent Study Showing Individual Control Sweat Collections, Sweating Ratios, Mean Values, and Per Cent Coefficient of Variations Panelist No. % Collections Coeff. 1/8/73 1/10/73 1/12/73 1/15/73 Axilla B C B C B C B C Mean Var. 1 R(T),mg 547 L (C), mg 319 Ratio 1.714 2 R (T), mg 606 L (C),mg 544 Ratio 1.113 3 R (T), mg 1027 L (C), mg 1180 Ratio 0.870 4 R (T), mg 376 L (C),mg 454 Ratio 0.828 5 L(T),mg 748 a R (C), mg 6'81 Ratio 1.098 6 R (T), mg 958 a L (C),mg 1726 Ratio 0.555 7 L (T), mg 536 R (C), mg 569 Ratio 0.942 808 613 735 493 433 530 1.638 1.415 1.386 514 92 b 330 463 116 377 1.110 0.793 0.875 1143 927 1085 1282 1057 1127 0.891 0.877 0.962 408 380 295 363 491 388 1.123 0.773 0.760 1254 1087 1042 1111 895 829 1.128 1.214 1.256 260 a 432 819 488 696 1391 0.532 0.620 0.588 479 552 501 519 548 622 0.922 1.007 0.805 606 1020 a 510a 730 696 22 435 704 433 561 488 22 1.393 1.448 1.177 1.301 1.434 11 469 710 a 269 a 567 489 28 408 616 216 375 424 27 1.149 1.152 1.245 1.512 1.163 14 1310 a 1247 840 a 1095 1084 13 1353 1357 968 1199 1190 11 0.968 0.918 0.867 0.913 0.908 3.4 511 a 491 263 a 372 387 21 522 500 302 401 428 17 0.97'8 0.982 0.870 0.927 0.905 12 1411a 927 938 810 1027 20 1350 737 776 606 873 26 1.045 1.257 1.208 1.336 1.192 8.3 685 352 499 581 573 39 1038 574 836 1059 976 40 0.659 0.613 0.596 0.548 0.588 9.1 594 a 540 407 a 439 506 11 637 620 398 520 554 13 0.932 0.870 1.022 0.844 0.918 7.6 Mean (T) 680 22 Mean (C) 705 22 Mean Ratio 1.015 9.3 Extremes in collections for each panelist. Data not used due to marked vari,ation from other values and collections below 100 mg. Data presented in Table I show control sweat collections from a portion of the data from a typical study. This table also shows mean values for sweat col- lections from each axilla of individual panelists and individual and mean sweating ratios for each panelist. Coefficients of variation of each of these means are also shown. This table is presented so the data presented in Table II can be more readily evaluated. In Table II are presented mean control values from a series of tests which were derived as shown in Table I. Data presented in Table II very clearly in- dicate that sweating ratios of individual panelists are much more reproduci- ble and are much less subject to day-to-day variations than are individual measurements of sweat output from individual axillae. These ratios are also
Purchased for the exclusive use of nofirst nolast (unknown)
From: SCC Media Library & Resource Center (library.scconline.org)