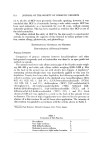
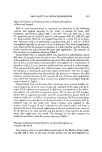
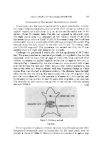
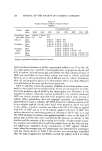
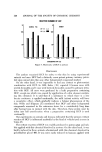
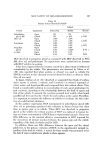
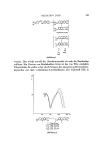
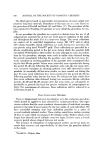
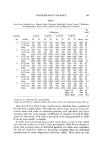
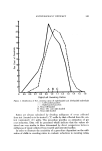
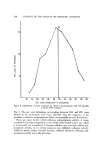
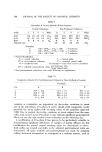
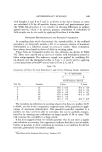
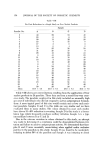
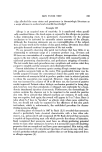
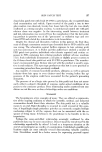
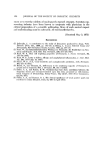
142 JOURNAL OF THE SOCIETY OF COSMETIC CHEMISTS Table II Mean Control Sweat Collections from Test (T) Axilla and Control (C) Axilla (Mean Sweating Ratios and Mean Coefficient of Variations for 8 Recent Tests) Axilla Time Spread Coef. Coef. Coef. No. of No. of of Detns of V,ar. of Var. Ratio of Var. Study Panelists Collections (Weeks) T(mg) (%) C(mg) (%) T/C (%) A 24 16 10 434 43 451 42 0.991 15 B 12 8 4 433 24 429 25 1.001 11 C 12 8 4 573 27 622 25 0.958 12 D 12 12 7 584 26 604 25 0.999 11 E 12 12 7 567 26 577 25 0.991 12 F 24 8 10 536 30 568 32 0.972 17 G 12 28 19 542 29 633 26 0.850 18 H 12 28 19 618 31 593 33 1.020 17 Mean 523 31 552 30 0.974 15 virtually independent of day-to-day variations in sweating rates observed in individual panelists. This is demonstrated in Table I, which indicates ex- tremes in sweat collections for each panelist and their corresponding sweating ratios. As reported by other investigators, e.g., Wooding (8), sweat output from the right axilla is slightly higher than from the left axilla. The distribution of panelists showing right-over-left ratios from 0.500 to 1.750 at 0.100 increments is shown in Fig. i for right-handed and left-handed individuals. The mean ratio for each group and the mean of all panelists determined from weighted values to compensate for the differences in numbers of right- and left-handed individuals are shown. Results of analysis of these randomly selected data indicate that there is a correlation between right-left sweating rates of panelists and whether they are right-handed or left-handed. As many of us have assumed, the dominant armpit produces slightly greater perspiration. There are many reversals in both groups and the mean R/L ratios of the two groups are not statistically different. In all cases, except where noted in the following discussions, per cent re- ductions in sweating were evaluated by determining the shift in sweating ratios. The mean control sweating ratios were determined in a minimum of eight collections distributed over at least four control days. The post-treat- ment sweating ratios were adjusted to compensate for the deviation of in- dividual mean control ratios from 1.000. The basic formula for these calcula- tions is: 1.000 - post-treatment ratio) 100 = % reduction in sweating mean control ratio

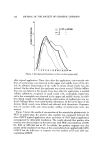
ANTIPERSPIRANT EFFICACY 143 2• 22, 20, 18, ½16, •14 ø12 olO, 8, 6 4 I I I I I I ß I I I I I I I I I ,- A B C I I I I ! I 0 0.5 0.6 0.7 0.8 0.9 1.0 1.1 ß 1.2 1.3 1.4 1.5 1.6 Right/Left Sweating Ratios Figure 1. Distribution of R/L sweating ratios of right-handed and left-handed individuals Left-handed panelists .... Right-handed panelists A. Mean left-h,anded B. Mean left- and right-handed C. Mean right-handed Ratios are always calculated by dividing milligrams of sweat collected from test (treated or to-be-treated) (T) axilla by that collected from the con- tro1 (untreated) (C) axilla. This procedure provides an estimation o{ per cent reduction. Data will be presented which indicate that the values ob- tained are very similar to those determined by direct comparisons between milligrams o{ sweat collected {rom treated and untreated axillae. In order to illustrate the sensitivity of a procedure dependent on the utili- zation of shifts in sweating ratios to evaluate reductions in sweating ratios,
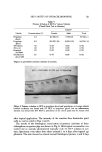
Purchased for the exclusive use of nofirst nolast (unknown)
From: SCC Media Library & Resource Center (library.scconline.org)