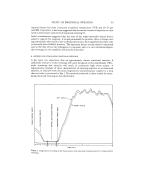
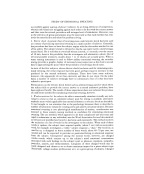
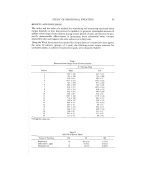
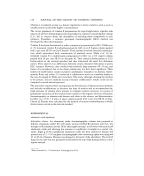
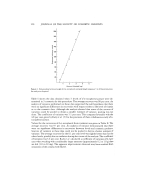
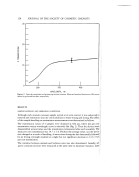
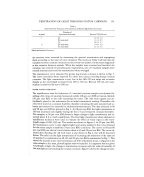
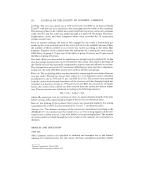
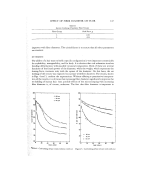
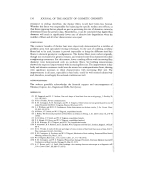
128 JOURNAL OF THE SOCIETY OF COSMETIC CHEMISTS 30 2O lO o 300 350 400 WAVELENGTH, nm Figure 2. Spectral transmittance of guinea pig stratum comeurn. Mean and standard deviation at 380 nm are shown by point and brackets, respectively RESULTS SAMPLE HANDLING AND OPERATING CONDITIONS '• Although each stratum corneum sample served as its own control, it was subjected removal and reinsertion into the cell in addition to water rinsing and drying. The effectill! of this sample handling on transmission measurements was determined as follows. The transmission values of 3 samples were obtained at 360 nm, where the per cent• !: transmission versus wavelength curve is relatively fiat (Fig. 2). Then the devices were 5•:} disassembled several times and the transmission remeasured after each assembly. The!• mean per cent transmission was 14.7 +' 1.0. Neither the average value, nor the derjail :i•i tion changed as a result of handling. A water rinse during the last disassembly followed:?! by air drying overnight resulted in a slight but not significant decrease to 13.6 -+'0.6)ii ! per cent transmission. The variation between animals and between sites was also determined. Initially, jacent corneum sections were measured at the same time to minimize variation. Latei ..

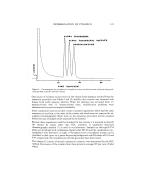
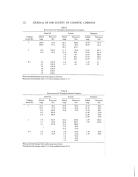
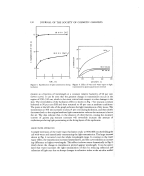
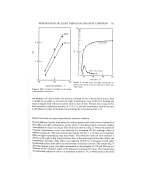
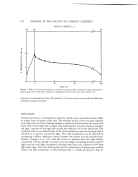
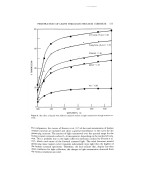
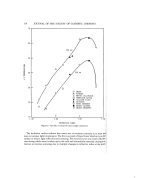
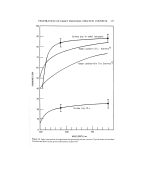
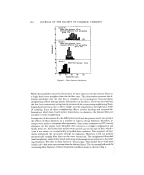
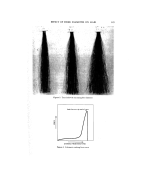
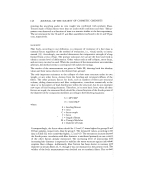
PENETRATION OF LIGHT THROUGH STATUM CORNEUM Table I Animal and Site Variation in Transmission of Guinea Pig Stratum Comeurn 129 Number of Animal Specimens Evaluated Per cent T @ 360 nm a (matched) 11.1 + 0.5 9 14.2 +-'3.7 2 4 (matched) 17.8 q-' 1.0 3 (matched) 11.1 q-' 1.1 *Mean and standard deviation :. the sections were screened by measuring the spectral transmission and segregating ':i them according to the type of curve obtained. The results in Table I indicate that the •" variation between stratum corneum sections from one animal is of the same magnitude :•. as the variation between animals. When the samples were screened and matched, the variation was reduced. In all subsequent experiments, sets of 3 matched samples were .: treated simultaneously and the transmission values averaged. ß The transmission curve obtained for guinea pig stratum corneum is shown in Fig. 2. The curve resembles those reported for other skin tissues including human stratum corneum. The light transmission is very low in the 280-290 nm range and increases :':' sharply as the wavelength increases from 290 to 340 nm. Beyond 360 nm, the trans- •:: mission is relatively fiat out to 600 nm. WATER VAPOR HY'DKATION The equilibration time for hydration of 3 matched corneum samples was obtained by adding a few drops of saturated potassium iodide (68 per cent RH) or barium chloride (90 per cent RH) to the cells containing the tissue. The cells were capped and im- mediately placed in the instrument for an initial transmission reading. Thereafter, the ::• cells were stored in a constant humidity chamber containing the same saturated salt so- lution and removed at intervals for additional measurements. The data obtained at 68 and 90 per cent RH are plotted in Fig. 3. At 68 per cent RH, the light transmission at :.• 360 nm increased only slightly during the first 2 h and remained constant thereafter. :. The samples at 90 per cent RH showed a larger change in light transmission and re- ..: quired about 8 h to reach equilibrium. The final light transmission values obtained at equilibrium hydration were used to evaluate the effect of water vapor in the wave- length range of 280-450 nm. The results are shown in Figure 4. At 90 per cent RH, the transmission curve is only slightly higher and nearly parallel to the curve obtained •: for the same sample at ambient (34 per cent RH) conditions. The curves at 68 and 80 per cent RH (not shown) were between those at 34 and 90 per cent RH. The curve ob- tained after flooding the cell with water is also shown in Fig. 4, but will be discussed below. The effect on the light transmission of increasing the hydration of the same set of samples by equilibration at 68, 80, and 90 per cent RH is summarized in Fig. 5. This shows the increase in per cent transmission (A %T) of hydrated tissue, compared to the same sample in dry state, plotted against relative humidity. It is apparent that at a given wavelength of light, the change in transmission increases with the relative humidity of the atmosphere surrounding the stratum comeurn. Figure 6 shows the change in trans-
Purchased for the exclusive use of nofirst nolast (unknown)
From: SCC Media Library & Resource Center (library.scconline.org)