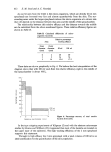
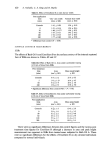
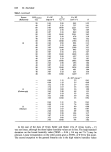
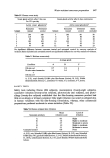
620 S. Nicholls, C. S. Kh•g and R. Marks Table II. Effect of Emollient B on skin furrow width Post application time 'Dry' skin width Normal skin width (min) (mm + SD) (mm _ SD) Controls 1.41 + 0.20 1.34 _+ 0.19 0 1.51 _+ 0.16 1.54 _+ 0.16 30 1.80 _+ 0'37* 1'54 + 0.21 60 1-57 + 0.11 1.45 + 0-12 120 1.52 _+ 0.16 1.37 _+ 0'15 240 1.77 _+ 0.40 1.43 _+ 0'26 * Difference from control (P -- 0'05) SURFACE CONTOUR MEASUREMENT SSBs The effects of Bath Oil A and Emollient B on the surface contour of the internal ruptured face of SSBs are shown in Tables III and IV. Table III. Effect of Bath Oil A. Area under surfometer tracing in 10 cm of trace from SSBs Post immersion time Area Mean peak height (min) (cm • + SD) + SD Controls 8'5 + 2.2 21'6 _+ 6-3 5 5'6 _+ 1.5' 16.4 + 4'5 60 8.2 + 1-9 18.5 + 1.8 240 6.9 + 2.3 15.9 + 5'0 * Significant difference from control 0'05 P 0'02 Table IV. Effect of Emollient B. Area under surfometer tracing in 10 cm of trace from SSBs Post application time Area Mean peak height (min) (cm ø• + SD) + SD Controls 6.32_+ 1-5 13.0 + 2.8 0 5'9 + 1.8 11.2 + 3'2 30 6.2 _+ 2.2 11.8 + 4-0 60 6.6 + 1.4 12.2 _+ 2.9 120 5'5 + 1.7 11.4 + 2.1 240 5'4 _+ 1.5 10.9 + 3'4 There were no significant differences between the control figures and the various post treatment time figures for Emollient B although a decrease in area and peak height measurement was apparent in SSBs from treated areas subjected to Bath Oil A. There were no significant differences for the effects of Emollient B on dry skinned individuals compared to normal individuals.

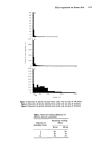
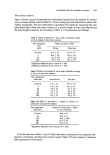
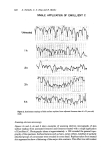
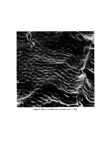
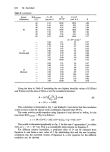
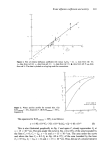
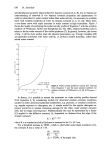
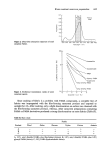
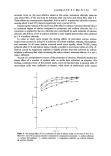
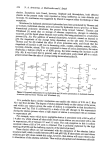
Emollients and the stratum corneum 621 Skin surface replicas Figure 2 shows a group of representative surfometer tracings from the replicas of a control area and areas treated with Emollient C. These tracings provide information about skin surface topography. We have attempted to quantitate the results by measuring the area (planimetrically) within the major contours in a known length of trace and determining the total length of contour by curvimetry. Tables V- VII summarise our findings. Table V. Effect of Bath Oil A. Area under surfometer tracing in 10 cm length of trace from replicas Post immersion time (min) Mean area (cm 2 _+ SD) Oil leg Water leg Controls 14'3 + 3.7 15'4 + 5.7 5 10'9 + 2.9 12'4 + 2.9 60 8'4 + 1.9' 9-3 + 2'2'1- 240 8.9 + 1.6' 10-1 + 2.0 * Significant difference from control P 0'01 t Significant difference from control P 0'05 Table ¾I. Effect of Emollient B. Area under surfometer tracing in 10 cm of trace from replicas Post application time (min) Normal skin Dry skin Controls 9'2 + 3.2 10.5 + 2.0 0 7.9 + 2.6 10'1 + 3.7 30 7.8 + 2.8 9.1 + 2.4 60 7'4 + 1-1 8.8 + 3-2 120 6.7 + 1.7 8.0 + 2'4 240 6-9 + 3.1 9.0 + 1.8 Table VII. Effect of Emollient C. Length of contour of surfometer tracings from replicas Post application time (min) Length of contour (cm + SD) in 8.5 cm of tracing Controls 38.0 + 6.3 60 34'4 + 6.1 120 30.6 + 7.09* 180 32.7 + 6.4 300 33.3 + 4.3 * Significant difference from controls (P 0.01) It can be seen from Tables V and VI that a decrease in replica area was apparent sub- sequent to treatment and that total contour length (Table VII) also appears to decrease after application of Emollient C.
Purchased for the exclusive use of nofirst nolast (unknown)
From: SCC Media Library & Resource Center (library.scconline.org)