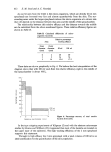
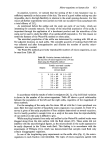
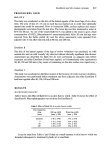
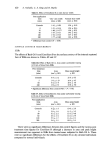
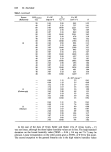
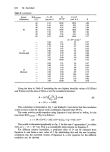
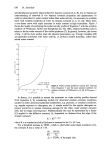
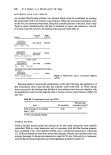
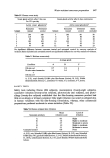
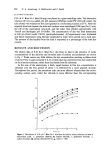
Water diffusion coefficients and activity 627 Jt where D -- AC D R = relative diffusion coefficient = m Do hC • Cinternal-- Cexternal t = stratum corneum thickness (cm), assumed to be 15 x 10 4 cm, a typical value for human stratum corneum (14) Cintcrna• = C o = 4'39 X 10 -3 mg cm -a CORRELATION The data used in the correlation is given in Table L It was found that there was generally a linear relationship between D and Col(Co - C). In those cases where the data does not include a value for Do, this was obtained by extrapolation of D against Col(Co - C) using linear regression. The extrapolated value of Do was then used to obtain values of R. Table I. Water activity of stratum corneum versus water diffusion coefficients from literature sources Source R.H.ex•mal C x l0 s Co D x 10 * (Reference) (•) (mg cm 4) Co-C (cm * h -•) R 12 0 2.195 2.00 28'5 1.00 29 2.83 2-81 31.2 1'09 55 3 '40 4'43 43 '7 1 '53 80 3.95 9.98 91.2 3'20 88 4.13 16.88 125.0 4'39 15 2.52 2.34 12.5 1.02 31 2.88 2'91 13-4 1-09 51 3'31 4'07 16.05 1'31 75 3'84 7'94 25.95 2'11 89 4-15 18-20 43'5 3'55 1.5 2.23 2-04 17'3 26 2'77 2'69 20-25 28 2.81 2'75 19'95 28 2'81 2'75 20'4 32 2-90 2'94 22'05 33 2.92 2'99 19'95 33 2'92 2'99 21 '9 34 2'94 3-03 22'8 45 3'18 3'64 23'55 49 3'27 3'92 25'5 53 3'36 4'26 29'85 56 3'42 4'55 27-15 59 3'49 4'88 32'55 2.6 2'25 2'05 12'6 25-0 2'74 2-67 26'4 49-0 3•27 3'92 31 '5 76'0 3'86 8'33 42-75 1.00 1'17 1'15 1'18 1'27 1'15 1-27 1'32 1-36 1 '47 i .73 1'57 1'88 1'00 2'10 2-50 3'40 Continued on next page

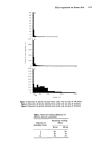
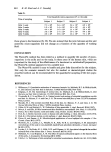
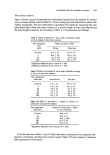
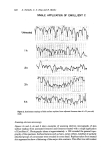
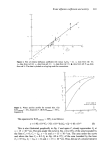
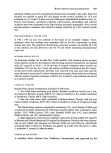
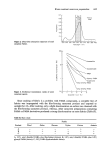
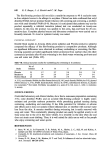
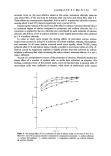
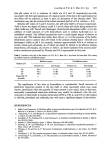
628 M. Stockdale Table I. (continued) Source (Reference) R.H.extemal (%) C x 10 • Co D x 10' (mg cm -•) Co -- C (cm* h -•) R 10 13 (Guinea-pig) 13 (Human) 20 2.63 2.50 58.5 1'25 40 3-07 3'33 75 '7 1-61 80 3'95 10.00 222.1 4'77 20 2-63 2.50 70-5 1.09 40 3'07 3'33 96'2 1'49 80 3'95 10-00 234'1 3'63 20 2.63 2.50 47'8 1.10 40 3'07 3'33 70.6 1'62 80 3'95 10'00 179'4 4'14 20 2.63 2'50 50'4 1'13 40 3.07 3'33 66.6 1'47 80 3'95 10'00 158'9 3-53 20 2'63 2'50 49'5 !.22 40 3'07 3'33 67'2 1'67 80 3'95 10.00 194'8 4'81 20 2.63 2'50 45'7 !'11 40 3'07 3'33 73'5 !'81 80 3.95 10'00 198'2 4'89 20 2'63 2.50 39'3 1'04 40 3'07 3'33 69'5 !'84 80 3'95 10.00 182'8 4'88 20 2'63 2'50 40'1 1'04 40 3'07 3'33 62'1 1'58 80 3'95 10'00 146'9 3'77 D x 10 xx cm sec -x 0.44 1.11 2.2 0'61 0.88 1.25 2.5 0.69 1'32 1'43 2.7 0'75 1-76 1.67 3.3 0.92 2.20 2.00 3'6 1.00 2.63 2-50 4.8 1.33 3.07 3'33 5.3 1.51 3'51 5.00 5'0 1.42 3'95 10.00 3-3 0'92 0'44 1'! 1 5-6 0'63 0.88 1-25 7-6 0'85 1'32 1.43 8.0 0'90 1.76 1.67 8.6 0'97 2.20 2.00 8.9 1'00 2.63 2.50 10.4 1'17 3.07 3'33 11-5 1.29 3'51 5.00 11.0 1.24 3'95 10.00 9'4 1'06 In the case of the data of Grice, Salter and Baker (11), D versus Co/(Co - C) was not linear, although the three higher humidity values are in line. The large standard deviation on the lowest humidity value (TEWL = 0.36 + 0.4 mg cm -a h -•) may be relevant. Linear extrapolation on the other points gives a TEWL of 0.76 for this point. The second exception to the general linearity rule is the high relative humidity values
Purchased for the exclusive use of nofirst nolast (unknown)
From: SCC Media Library & Resource Center (library.scconline.org)