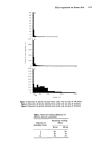
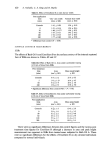
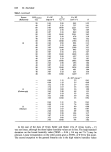
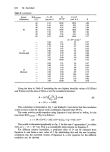
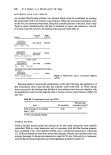
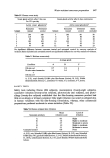
Water diffusion coefficients and activity 631 In the case of the data of E1-Shimi and Princen, no correction is necessary for the C values. The reference state for R determinations is, however, changed to C = 0.70 Co and thus the values of R need modifying. The corrected values of C and R are given in Table H. Table II. Water activity versus diffusion coefficients, corrected data Source R.H.ext•raal C x 10 2 Co D x 10 a (Reference) (•o) (mg cm -a) Co-C (cm • h -•) R 0 3'07 3'33 28'5 29 3'46 4'72 31'2 9 55 3'80 7'44 43 '7 80 4'13 16'88 91'2 88 4'23 27'44 125'0 15 3'27 3'92 12'5 31 3'48 4'82' 13-4 4 51 3'75 6.86 16'05 75 4'06 13'30 25'95 89 4'25 31'36 43'5 1'5 3'09 3'38 16'2 26 3'42 4'53 20'25 28 3'44 4'62 19'95 28 3'44 4'62 20'4 32 3'50 4'93 22'05 33 3'51 4'99 19'95 33 3 '51 4'99 21 '9 34 3-52 5'05 22'8 12 45 3'67 6'10 23'55 49 3'72 6'55 25'5 53 3'77 7'08 29'85 56 3'81 7'57 27'15 59 3'85 8.13 32'55 2.6 3'11 3'43 12'6 25 3'40 4-43 26'4 11 49 3-72 6.55 31 '5 76 4'08 14.16 42.75 20 3'34 4'18 58.5 40 3'60 5'56 75'7 80 4-13 16'88 222'1 20 3'34 4'18 70'5 40 3-60 5'56 96'2 80 4'13 16-88 234-1 20 3-34 4'18 47'8 10 40 3'60 5'56 70'6 80 4'13 16'88 179'4 20 3'34 4'18 50'4 40 3'60 5'56 66'6 80 4'13 16'88 158'9 20 3'34 4'18 49'5 40 3'60 5'56 67'2 80 4.13 16.88 194'8 20 3'34 4'18 45'7 40 3.60 5'56 73 '5 1.00 1 '09 1'53 3'20 4-39 1 '02 1 '09 1'31 2'11 3'55 1'00 1'17 1'15 1'18 1'27 1'15 1 '27 1-32 1'36 1'47 1 '73 1-57 1'88 1'00 2-10 2'50 3'40 1 '25 1-61 4'77 1 '09 1 '49 3-63 1'10 1'62 4-14 1'13 1 '47 3'53 1 '22 1'67 4'81 1'11 1'81 Continued on next page

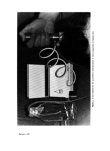
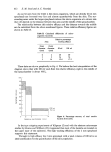
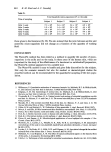
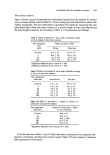
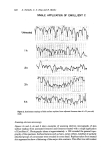
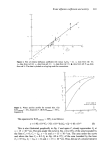
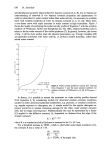
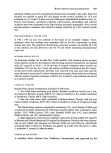
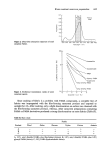
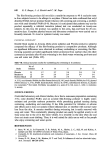
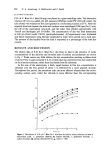
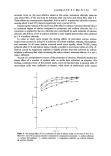
632 M. Stockdale Table II. (continued) Source R.H.external (Reference) (%) Cx 102 Co D x 10 a (mg cm -a) Co-- C (cm" h -1) a 10 13 (Guinea-pig) 13 (Human) 80 4-13 16'88 198.2 4'89 20 3.34 4.18 39.3 1 '04 40 3.60 5.56 69.5 1.84 80 4.13 16.88 182.8 4'88 20 3.34 4'18 40-1 1'04 40 3.60 5.56 62-1 1.58 80 4.13 16.88 146-9 3.77 D x 10 aa cm sec -x 0.44 1.11 2.2 0.37 0.88 1-25 2.5 0.42 1.32 1.43 2.7 0.45 1.76 1.67 3.3 0-55 2.20 2.00 3.6 0.60 2.63 2.50 4.8 0.80 3.07 3.33 5.3 0.90 3.51 5.00 5.0 0.85 3.95 10.00 3-3 0-55 0'44 1'11 5.6 0'47 0'88 1.25 7'6 0'64 1.32 1 '43 8'0 0'67 1 '76 1 '67 8'6 0.72 2'20 2.00 8'9 0.75 2'63 2'50 10'4 0.87 3-07 3.33 11'5 0.96 3'51 5.00 11'0 0-92 3.95 10-00 9.4 0.79 Using the data in Table H (excluding the two highest humidity values of E1-Shimi and Princen and the data of Grice et al.) the correlation becomes: R -- 0.175(coC•øC)-3-0.46 n = 61 r ----- 0.902. (6) This correlation is illustrated in Fig. 1 and Student's t test shows that the correlation could not have arisen by chance with a confidence of greater than 99'9•o. The water activity profile equation using Equation 6 and derived as before, for the case where R.H.external = 0•o, is as follows: x = 1.54x 10-•Ci-2.62 x 10 -4 In (Co-C-t)-8'23 x 10 -4 (7) This profile is illustrated graphically in Fig. 2. In this case C approaches Co to within 3'4•o at x = 15 x 10 -4 cm. This is a considerable improvement on Equation 5. For different relative humidities, a predicted value of D can be obtained from Equation 6, and hence a new value of J. By substituting this and the new boundary conditions into the corrected version of Equation 4, a new equation for the different condition can be derived.
Purchased for the exclusive use of nofirst nolast (unknown)
From: SCC Media Library & Resource Center (library.scconline.org)