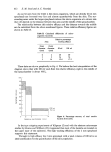
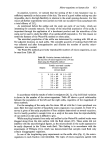
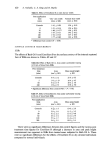
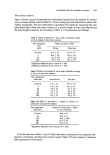
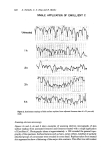
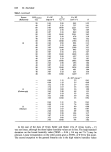
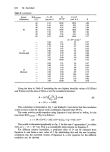
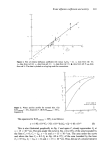
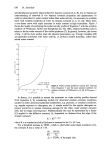
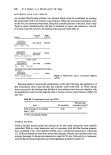
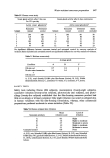
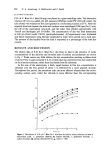
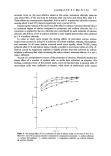
628 M. Stockdale Table I. (continued) Source (Reference) R.H.extemal (%) C x 10 • Co D x 10' (mg cm -•) Co -- C (cm* h -•) R 10 13 (Guinea-pig) 13 (Human) 20 2.63 2.50 58.5 1'25 40 3-07 3'33 75 '7 1-61 80 3'95 10.00 222.1 4'77 20 2-63 2.50 70-5 1.09 40 3'07 3'33 96'2 1'49 80 3'95 10-00 234'1 3'63 20 2.63 2.50 47'8 1.10 40 3'07 3'33 70.6 1'62 80 3'95 10'00 179'4 4'14 20 2.63 2'50 50'4 1'13 40 3.07 3'33 66.6 1'47 80 3'95 10'00 158'9 3-53 20 2'63 2'50 49'5 !.22 40 3'07 3'33 67'2 1'67 80 3'95 10.00 194'8 4'81 20 2.63 2'50 45'7 !'11 40 3'07 3'33 73'5 !'81 80 3.95 10'00 198'2 4'89 20 2'63 2.50 39'3 1'04 40 3'07 3'33 69'5 !'84 80 3'95 10.00 182'8 4'88 20 2'63 2'50 40'1 1'04 40 3'07 3'33 62'1 1'58 80 3'95 10'00 146'9 3'77 D x 10 xx cm sec -x 0.44 1.11 2.2 0'61 0.88 1.25 2.5 0.69 1'32 1'43 2.7 0'75 1-76 1.67 3.3 0.92 2.20 2.00 3'6 1.00 2.63 2-50 4.8 1.33 3.07 3'33 5.3 1.51 3'51 5.00 5'0 1.42 3'95 10.00 3-3 0'92 0'44 1'! 1 5-6 0'63 0.88 1-25 7-6 0'85 1'32 1.43 8.0 0'90 1.76 1.67 8.6 0'97 2.20 2.00 8.9 1'00 2.63 2.50 10.4 1'17 3.07 3'33 11-5 1.29 3'51 5.00 11.0 1.24 3'95 10.00 9'4 1'06 In the case of the data of Grice, Salter and Baker (11), D versus Co/(Co - C) was not linear, although the three higher humidity values are in line. The large standard deviation on the lowest humidity value (TEWL = 0.36 + 0.4 mg cm -a h -•) may be relevant. Linear extrapolation on the other points gives a TEWL of 0.76 for this point. The second exception to the general linearity rule is the high relative humidity values

Water diffusion coefficients and activity 629 from the kinetic experiments of E1-Shimi and Princen (13). Rieger and Deem (4) have shown that equilibrium times in steady state flux experiments at high humidities are long. Therefore it is not surprising that there are differences between steady state and kinetic experiments at these high humidities. The layers of skin with high water activities (the inner layers) will not be subject to large, or rapid variations in water content and the steady state results seem likely to be the most applicable. The E1-Shimi and Princen data is useful, however, in extending the range of experimental points to lower water activity (C) values, where differences between steady state and kinetic experiments will be less important. Excluding the data of Grice et al. and the two highest humidity points of E1-Shimi and Princen, the following correlation is obtained by linear regression analysis: R = 0.29(C%)+0.50 (2) n = 61 r = 0.894. Including the data of Grice et al. and all except the highest humidity points of E1- Shimi and Princen, the correlation is R = 0.29( Cø ) Co- C +0.51 (3) n = 67 r = 0.885. Correlations within a given set of data are better than the above. Most correspond well with linear relationships with some variation in the gradients. WATER ACTIVITY PROFILES In order to examine the effect of the above relationships on the water content profile of stratum corneum, it is necessary to assume that it is possible to extrapolate from the average values of water content and relative diffusion coefficient (C and R) to single point values (Ci and Ri). Well and Princen (6) have illustrated one of the dangers of making such assumptions, in connection with the effect of surface barrier layers on TEWL. The data of E1-Shimi and Princen used above, however, does not suffer from this disadvantage and the average gradient for their two sets of points is the same as that for the other sets of data. This suggests that the assumption will introduce less error than is inherent in the correlation itself. Thus, from Equation 1, dx Di RiD o -- -- dCi J J From Equation 2, where dx 0.2_9Do( Co '• 0.50Do •-•i -• J \Co- Ci] -[ • dx M d Ci Co -- Ci + N 0'29DOC0 M= J 0'50D o J
Purchased for the exclusive use of nofirst nolast (unknown)
From: SCC Media Library & Resource Center (library.scconline.org)