136 JOURNAL OF THE SOCIETY OF COSMETIC CHEMISTS After the MED had been determined, an area 5 x 10 cm was outlined in ink on the second tested site 100 /al of the product being tested was applied as uniformly as possible by finger, resulting in an overall average application of 2 $zl/cm 2. The product was then allowed to dry for 15 min. After this period, five graded exposures were given using the solar simulator to determine an MED for the protected area. These exposures were likewise read the next day and an SPF calculated. A Sun Protection Factor (SPF) is the ratio of the product-treated MED to the untreated (control) MED. SPF results for each product were then averaged for all volunteers tested. To test for water resistance, the procedure outlined above was followed but included immersion of the product-treated arm into a circulating 35øC whirlpool bath for either 10 or 40 min. The treated area was carefully air-dried before solar simulator exposures were given. SPF values were calculated as before. For two of the products examined, D and E, the outdoor swimming test proposed by the Food and Drug Administration was performed (14). This consists of two 20-min swimming sessions with a 20-min rest in between. The backs of the volunteers were used in this study, and solar simulator exposures were given as described above, following water exposure. Hairless mouse studies. Male and female Skh-1 and Skh-2 strain hairless mice (Skin and Cancer Hospital, Philadelphia), 5-6 weeks old, were sacrificed by cervical dislocation and the skin removed from the dorsal area of the body. After immersion in 60øC water for 30 sec, the epidermis was removed intact from the dermal layers by careful blunt dissection following the method of Blank (15). The epidermal layer was then floated onto a quartz carrier plate and the excess moisture carefully removed. Each piece of epidermis used ranged from 5 cm 2 to over 10 cm 2. Forward scattering scans were run from 400 to 250nm in the Beckman Acta MVI recording spectrophotometer fitted with a diffuse reflectance sphere. Additional 2 mm UG-5 filters were used in both the sample and the reference beams to remove visible fluorescence from the epidermis and from some of the sunscreen formulas tested. For each piece of epidermis examined, the first measurement obtained was a forward scattering scan of the unprotected epidermis. The carrier plate with the epidermis was then removed from the reflectance sphere and the epidermal area measured. The sunscreen to be tested was applied at a concentration of 2 /al/cm 2 and the forward scattering scan repeated for the epidermis with its applied product. To determine the absorption of the sunscreening product alone, the absorption of the untreated mouse epidermis was subtracted from the values for the product-treated epidermis point by point at 5 nm intervals. This method has been previously described in detail (1). Following this initial scanning procedure, the holder containing the mouse epidermis was placed into a shaking 35øC water bath. At 10 and at 40 min, the holder was removed, dried and rescanned to determine how much sunscreen had been lost. Calculations were performed as above. For each formula tested, at least three separate scans were run on different epidermal sections. The absorption values were then averaged and the difference spectra plotted so that the absorption spectra could be compared. Prediction of sunscreen e•cacy from in vitro data. The SPF of a sunscreen is equivalent to the reciprocal of the transmission of erythemic light by a sunscreen film, at least in the monochromatic approximation. The model used in this study is based on the

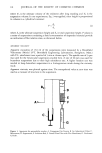
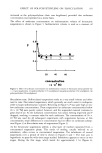
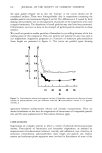
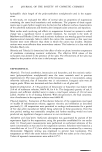
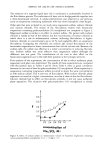
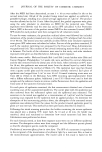
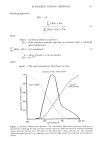
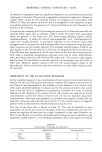
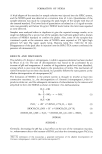
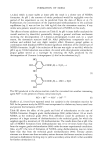
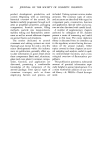
SUNSCREEN TESTING METHODS 137 following equations: SPF = I/T •. E E(X) x I(X) •. EE(X) x I(X) x T(X) where EE(X) = erythermal efficiency spectrum I(X) = Solar simulator intensity spectrum as measured with a calibrated spectroradiometer. • EE(X) x I(X)= 1.0 (normalized) (2) X = 290 to 320 nm in 5 nm increments T(X) = 10 -abs(x) where abs(X) = The sunscreen product absorbance on skin. CONVOLUTION SPECTRUM 1.O - ,.... • .•. ERYTHEMA".. ,' SOLAR • ".. / • ,,'SIMULATOR m 0.6- •J 0.4- 0:0.2- ' I I 290 300 310 320 NM WAVE LENGTH Figure 1. Erythemal Effectiveness Spectrum. The convolution effectiveness spectrum (solid line) is obtained by multiplying the solar simulator emission spectrum (dash/dot line) by a reciprocal erythemal energy spectrum (dotted line). The peak of this spectrum is about 304-305 nm. The erythemal effectiveness spectrum will vary depending upon both the light source and erythemal action spectrum chosen.
Purchased for the exclusive use of nofirst nolast (unknown)
From: SCC Media Library & Resource Center (library.scconline.org)