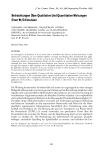
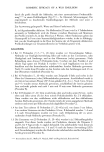
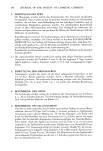
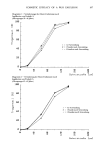
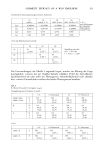
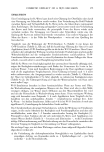
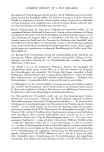
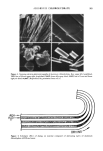
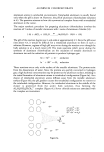
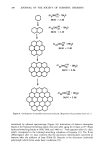
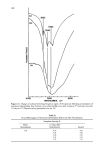
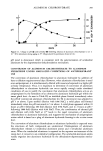
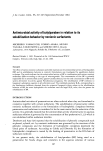
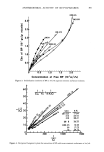
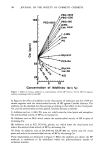
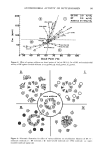
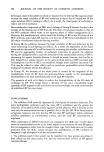
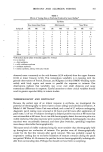
ALUMINUM CHLOROHYDRATE 291 UNTREATED DEUTERATED A A B B • C D E E 3470 3520 , • i I I I 3500 3200 3500 3200 WAVE NUMBER, crn -I Figure 9. Change in hydroxyl-stretching frequency region of IR spectrum of aluminum hydroxide gel for untreated and deuterated samples during aging at 25 ø. Key: A, fresh precipitate B, 42 days C, 59 days D, 74 days E, 81 days F, 97 days and G, 147 days. (Reproduced by permission from ref. 17.) STRUCTURAL CHANGES IN ALUMINUM CHLOROHYDRATE FOLLOWING DILUTION Aluminum chlorohydrate is also unstable upon dilution with water. When a commer- cial aluminum chlorohyrate solution (6.2 M in aluminum) was diluted to 2.5 x 10 -2 M in aluminum, the pH increased initially but later decreased (Figure ll). The diluted aluminum chlorohydrate solution became turbid after 3 days, corresponding to the time when the pH began to decrease. The insoluble phase was collected by filtration and examined by infrared spectroscopy (Figure 12). The hydroxyl-stretching bands of the insoluble phase coincide with the hydroxyl-stretching bands of gibbsite, the polymorph of aluminum hydroxide which forms under acidic conditions (15). The infrared spectrum of the lyophilized tiltrate was identical to the reference spectrum of aluminum chlorohydrate. It is believed that dilution of aluminum chlorohydrate causes the highly charged aluminum polycations to become widely separated, thereby reducing the stabilizing effect of the chloride counterions and the other aluminum chlorohydrate complexes. The tetrahedral aluminum is exposed to the aqueous environment as the Al•304(OH)24(H20)u 7+ complex dissociates. Since the octahedral configuration is the stable form of aluminum in acidic solution, the tetrahedral aluminum converts to an octahedral configuration. Exposure of the four negatively charged oxygens, which form the outer shell of the aluminum tetrahedron, to the aqueous environment results in the attraction of protons and water to complete the octahedral configuration. The adsorption of protons is reflected in the initial increase in pH. However, the long term

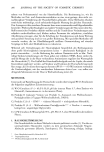
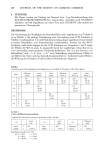
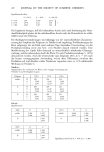
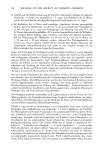
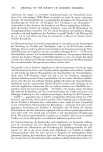
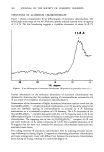
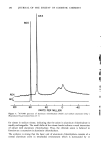
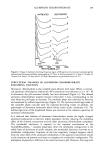
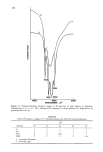
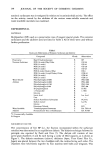
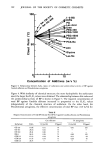
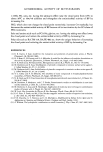
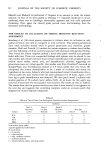
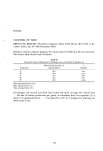
292 4000 :5500 :5000 WAVENUMBER, crrF • Figure 10. Change in hydroxyl-stretching frequency region of IR spectrum following neutralization of aluminum chlorohydrate. Key: bottom curve, initial middle curve, after 10 days at 25ø and top curve, after 111 days at 25 ø. (Reproduced by permission from ref. 18.) Table II X-ray Diffractogram of Aluminum Chlorohydrate Before and After Neutralization Interplanar Spacing, • Before 111 Days After Neutralization Neutralization Bayerite 11.8 4.72 4.72 4.35 4.36 3.20 3.19 2.22 2.21 1.72 1.71
Purchased for the exclusive use of nofirst nolast (unknown)
From: SCC Media Library & Resource Center (library.scconline.org)