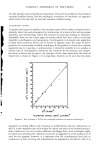
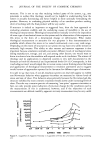
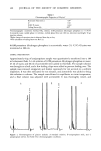
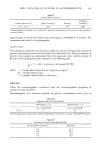
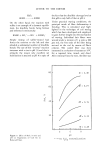
STABILITY ASSESSMENT OF EMULSIONS 353 in rapidly spotting problems. For example, as shown in Figure 4, an apparent viscosity change of some significance occurs as the product cools some time after emulsification of a wax-containing lotion, apparently due to a change in the rate of wax recrystalliza- tion. We saw earlier in Figure 3 that an abrupt drop in apparent viscosity occurred when the lotion was subjected to a temperature at or above the melting point of some ingredient or ingredients. The Brookfield viscometer with a helipath attachment has been used to detect the tendency for creaming or sedimentation (14). By measuring apparent viscosity at various depths within the disperse system, using very low spindle speeds, it was possible to detect differences in concentration of dispersed particles arising from particle movement upward or downward at early stages before this was apparent by visual means. Because emulsions exhibit non-Newtonian rheology, continuous shear rheometry, which allows one to relate shear stress to rate of shear with a known and continually variable rate of shear, is widely used in emulsion evaluation (15). Emulsions ranging from pourable liquids to semi-solids will typically exhibit the curves shown in Figure 5. SHEAR STRESS Figure 5. Rate of Shear vs. Shear Stress for semi-solid o/w emulsions varying in emulsifier concentra- tion. Hysteresis between values obtained upon increasing and decreasing shear arises because of structure breakdown and a time dependency for restructuring. If this process is reversible and isothermal we speak of thixotropic behavior. More often, as seen in Figure 6, however, when we deal with emulsions the process involves an

354 JOURNAL OF THE SOCIETY OF COSMETIC CHEMISTS t4 t3 t2 SHEAR STRESS Figure 6. Rate of Shear vs. Shear Stress for a semi-solid emulsion sheared after different time periods of rest: t• t 2 t 3. irreversible breakdown due to major structural changes. In such cases, after the first rheological run we are no longer really dealing with the original emulsion, and subsequent testing may be meaningless. Despite this limitation, however, continuous shear rheometry does allow some interpretation, particularly if the emulsion exhibits a well-defined yield value or "spur" in the rheogram, as shown in Figures 5 and 6. The yield value or spur clearly reflect the basic gel-like structure of an emulsion. Therefore, any change in its value or appearance must be a reflection of a change in structure and instability. Unfortunately, many investigators concentrate their efforts on studying the regions of high shear and do not see the subtle changes which often show up at the lower shear values. I would argue, therefore, that we would probably learn much more about emulsion instability, and even have a chance at predicting failure, if we concentrate on rheological measurement at as low a shearing stress as possible. Hiestand (14), for example, has suggested a relatively simple test of a dispersion's ability to withstand "curdling" or other changes in floc structure which might be brought about by vibration or other forms of gentle movement during the shipment of products. The dispersion is placed in a bottle which rotates slowly, e.g., 4 revolutions per hour. The slow agitation tends to cause breaking of the floc at some points, but allows time for reestablishing flocculation at other points. This apparently results in a totally different floc structure and a change in the characteristics of the dispersion. The type of bond breaking and making just described is characteristic of systems exhibiting the phenomenon of viscoelasticity for which there is a sound theoretical
Purchased for the exclusive use of nofirst nolast (unknown)
From: SCC Media Library & Resource Center (library.scconline.org)