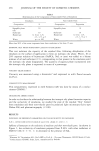
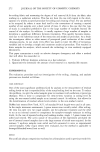
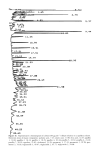
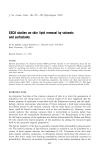
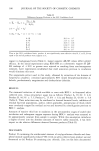
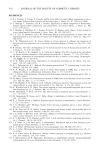
ESCA STUDIES OF SKIN LIPID REMOVAL 289 examined by ESCA was approximately 5ram x 5mm. The vacuum in the main chamber of the spectrometer during accumulation of spectra was typically of the order of 5 x 10 -8 torr. The atomic percentage of each element observed at the surface of the skin sample was calculated by measuring the peak area and using sensitivity factors for these elements. The relative amount of skin lipid removal or non-protein material was estimated by measuring the relative amount of nitrogen present at the surface. As the skin lipid is removed, there is an increase in the relative amount of nitrogen and, therefore, protein. The surface composition and lipid removal from the skin surface varies from source to source. To avoid the error caused by this variation, skin pieces from the same sample are evaluated by ESCA, then treated and remeasured to detect changes caused by solvents or surfactants. For solvent studies, only one replica was analyzed for each sample, while for surfactants, the average of two samples for each condition is reported. RESULTS AND DISCUSSION UNTREATED SKIN Since ESCA is a non-destructive technique, samples can be analyzed before and after treatment. An ESCA survey scan of every untreated skin sample was made from 0 to 1,000 eV, to determine which elements are present at the skin surface. This is shown in Figure 1. Every untreated skin surface contains carbon, oxygen, and silicon, although C AUGER L 0 A•GER 0 Is 0 I I I I I I I -I000 -900 -800 -700 -600 -$00 -400 -$00 Si :•p Si 2s - 200 - I00 0 BINDING ENERGY ,(eV) Figure 1. ESCA survey spectrum of untreated skin.

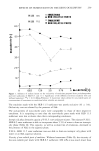
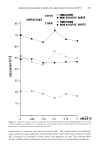
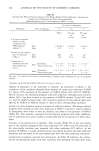
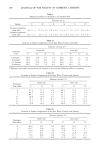
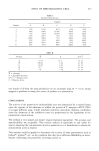
290 JOURNAL OF THE SOCIETY OF COSMETIC CHEMISTS Table I Elemental Analysis of the Surface of Untreated Skin Elements (at %) Sample C O N Si S P Untreated epidermis (outer side) 84.3 -+ 4 12.4 _+ 1.9 0.8 _+ 0.1 2.2 _+ 1.7 0.1 _+ 0.1 0.2 _+ 0.1 Untreated epidermis (inner side) 87.7 -+ 2 9.9 -+ 1.1 1.2 _+ 0.3 0.6 -+ 0.2 0.2 _+ 0.1 0.4 _+ 0.1 Table II Variation in Surface Composition of the Skin When Treated with Ether Elements (Atomic %)* Outer side Inner side Treatment Time C O N Si C O N Si Untreated 86.5 10.8 0.9 1.8 89.6 8.9 1.1 0.4 30 seconds 85.5 12.3 0.8 1.4 89.0 9.5 1.0 0.4 2.5 minutes 86.4 12.0 0.8 0.8 89.0 9.9 1.1 30 minutes 86.3 12.3 1.0 0.4 88.5 10.3 1.2 -- * Elements with small concentrations are omitted in this and the following tables for simplicity. Table III Variation in Surface Composition of the Skin When Treated with Acetone Elements (Atomic %) Outer side Inner side Treatment Time (Min) C O N C O N 0 87.3 11.9 0.8 88.1 11.0 0.9 2 84.2 14.4 1.4 84.7 13.0 3.0 7 84.1 14.0 1.9 81.3 13.3 5.4 17 78.8 16.6 4.6 74.1 16.4 9.5 27 73.1 18.7 8.1 71.5 16.3 12.2 37 75.1 17.3 7.6 71.4 16.6 12.0 47 72.8 18.4 8.8 69.0 17.5 13.5 Table IV Variation in Surface Composition of the Skin When Treated with Ethanol Elements (Atomic %) Outer side Inner side Treatment Time (Min) C O N C O 0 86.9 12.3 0.8 88.1 10.3 1.6 2 83.7 13.0 3.3 81.6 13.7 4.7 7 81.0 15.0 4.0 77.8 14.5 7.7 17 77.7 16.1 6.2 76.4 14.8 8.8 27 75.2 16.8 8.0 73.0 15.7 11.3 37 71.9 17.3 10.8 67.6 18.5 14.0
Purchased for the exclusive use of nofirst nolast (unknown)
From: SCC Media Library & Resource Center (library.scconline.org)