SKIN ROUGHNESS MEASUREMENTS 387 (9). In order to take advantage of the relatively low cost of determining the electrical properties of the skin, the Corneometer CM 820 PC (Courage 8: Khazaka Electronic GmbH, D-5000 Cologne 41, Germany) was chosen. It avoids the disadvantages in impedance methods that use direct current or low frequency, such as polarization of electrodes and impedance contact (10). The equipment measures the dielectric constant of the skin. The glass-coated capacitor, which is simply pressed against the skin, sets up a capacitance proportional to the moisture content of the stratum corneum, and this is displayed digitally. MEASUREMENT OF THE ADSORPTION OF METHYLENE BLUE Testing skin roughness, based on the amount of methylene blue which is adsorbed by the skin, has been described in detail by Padberg (11). The authors have made some alterations to this method. Methylene blue, as a cation, is bound by the anionic groups of the stratum corneum. The rougher the skin, the greater surface area and the more methylene blue it can adsorb. To remove dirt, skin grease, and cosmetic residues, the skin was first washed with a 1% non-ionogenic surfactant solution (Nonoxynol-30 Arkopal N 300©) after 30 minutes drying, it was stained with the methylene blue solution. This solution consists of up to 80% of a 1% non-ionogenic surfactant solution and 20% of a 0.5% methylene blue solution. The unbound color was removed using a 0.25 % non-ionogenic surfactant solution. The bound color was then extracted with a solution consisting of 2% sodium lauryl sulphate, 50% isopropyl alcohol, and 48% demineralized water. Extinction was determined at 660 nm in the spectral photometer, and used as the value for roughness. TEST DESIGN First study. All the investigations were carried out on a group of twenty female test subjects between the ages of 35 and 60. The image analysis method was used in parallel with the stylus method and the meth- ylene blue procedure. After 20 minutes' acclimatization at 22øC and 60% relative humidity, two impressions were made of each area, one for scanning and the other for image analysis. In our experience, the results are not adversely affected by preparing several impressions from the same area. Finally, the methylene blue test was carried out. Altogether 22 ranges of branded skin care products were tested in this way. Since all the products were tested on the same group of subjects and only four areas on the forearms were available, the tests were done in several runs. Before beginning with new products, there was a three-day interval without cosmetics in each case. In this way, overlap effects were avoided as far as possible. In order to test all the products within the same period of time, the test subjects started with different products, so that at any point in the test all products were being used. At the start of the period of use, an initial value was established for each method. The final values were determined after 14 days' use, with twice-daily application on the volar

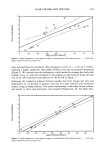
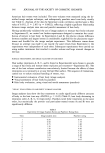
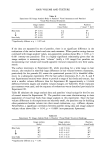
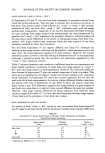
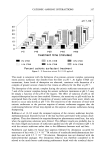
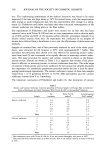
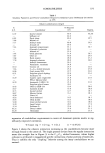
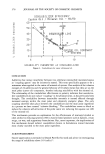
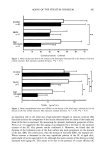
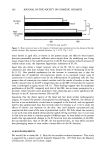
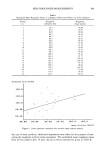
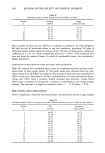
388 JOURNAL OF THE SOCIETY OF COSMETIC CHEMISTS forearm, and were measured 12 hours after the final application. The object of this interval was to ensure that the areas were free of product. Short-term effects of the products were thus excluded from the measurement. Due to the fact that stylus measurements had to be carried out in another laboratory, we only had the capacity to evaluate 120 replicas of six products using the stylus instru- ments. The products were chosen at random. Secondstudy. In a second study 14 skin creams were investigated. The test design for this study was identical to that described above. However, impressions were prepared only for image analysis and the measurement of skin moisture. The test subjects were of the same age group as in the first study but not identical. STATISTICAL ANALYSIS The 20 individual data sets that were obtained at the beginning and end of each test for each parameter were normalized. The initial value was set at 100%, so that the value after use indicates the percentage change that the product has achieved for each param- eter. As it was possible to test sufficient products for the comparison of the image analysis method with the stylus method and the image analysis method with the moisture measurement, the final results were tested for correlation by the linear regression method. However, in the comparison with the stylus method, the normalized individual values of the test subjects were used for the correlation, since the data from the final results of only six products were not sufficient for that purpose. r = regression coefficient p = probability of error RESULTS COMPARISON OF THE METHYLENE BLUE METHOD WITH THE IMAGE ANALYSIS METHOD Table I contains the normalized mean roughness values of 22 ranges of skin care products on 20 test subjects. Each range was used for 14 days by the same test subjects. The initial value for each series was taken as 100%. The values given are those after 14 days' use followed by a 12-hour interval. Values below 100% mean that the product tends to smooth the skin. Values over 100% show skin-roughening tendencies. Linear regression analysis was carried out with the values in Table I. The results in Figure 1 show a significant relationship between the two methods (r = 0.48 p 0.05). COMPARISON OF THE STYLUS METHOD WITH THE IMAGE ANALYSIS METHOD Table II shows the normalized image analysis results from six products in Study 1. In
Purchased for the exclusive use of nofirst nolast (unknown)
From: SCC Media Library & Resource Center (library.scconline.org)