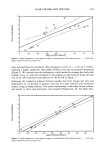
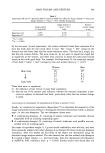
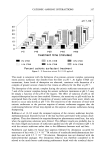
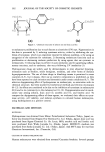
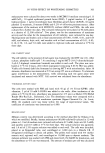
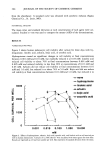
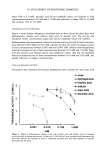
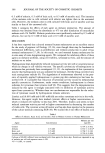
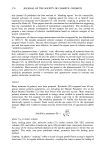
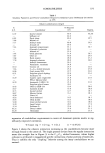
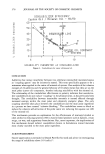
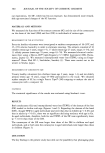
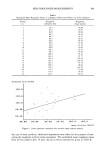
SKIN ROUGHNESS MEASUREMENTS 389 Table I Normalized Mean Roughness Values of 22 Ranges of Skin Care Products on 20 Test Subjects Product Roughness, Roughness, no. methylene blue image analysis ! 78.7 94.86 2 8!.6 92.93 3 84.8 9O.94 4 86.5 93.9! 5 88.3 95.57 6 88.7 95.97 7 90.0 94.70 8 90.0 97.05 9 94.9 97.52 !0 98.0 92.83 11 98.5 92.47 !2 98.7 97.83 !3 !00.6 95.97 14 103.6 97.77 15 104.4 102.54 16 105.3 102.54 17 105.5 97.76 18 !09.3 98.65 19 110.3 102.55 20 !13.5 57.09 21 114.5 94.45 22 122.7 95.9! Methylene blue method 120.0- 110.0- 1oo.o- 90.00 90 I I I I I Image Analysis Method Figure 1. Linear regression: methylene blue method-image analysis method. the case of these products, additional impressions were taken for the purpose of mea- suring the roughness with the stylus equipment. The normalized mean roughness values from 20 test subjects after 14 days' use and 12-hour intervals are given in Table II.

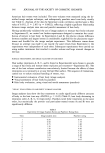
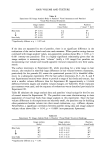
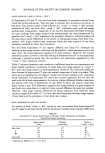
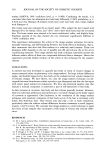
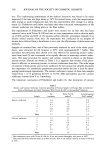
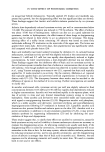
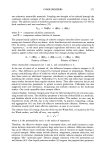
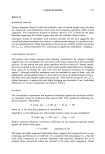
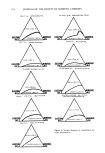
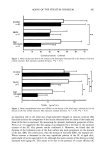
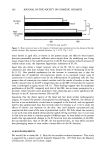
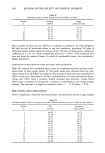
390 JOURNAL OF THE SOCIETY OF COSMETIC CHEMISTS Table II Normalized Image Analysis Results From Six Products in Study 1 Product Scanning Image no. method analysis method 4 92.41 93.91 9 100.18 97.52 12 95.31 97.83 16 95.13 102.54 19 95.19 102.55 20 99.50 97.09 Since six pairs of values are not sufficient to calculate a correlation, we were obliged to fall back on the 20 individual values to test the correlation, providing 120 pairs of individual values. Linear regression analysis of the 120 pairs of values gives a correlation coefficient of r = 0.315, with a probability of error p 0.001. (The individual data were not listed for reasons of space.) In spite of considerable scatter, the correlation is highly significant. COMPARISON OF SKIN MOISTURE WITH THE IMAGE ANALYSIS METHOD Table III contains the normalized mean values for roughness and skin moisture evalu- ations from 14 skin creams (Study 2). The mean values were obtained from the indi- vidual values from 20 female test subjects. The untreated mean value was normalized to 100% in each case. The results of 14 days' use followed by a 12-hour interval are shown. Values over 100% mean a tendency toward increased skin moisture. Values below 100% mean a tendency to drying and a tendency to smoothness in the image analysis method. The outcome is a negative correlation with r = -0.59 and p 0.05. DISCUSSION AND CONCLUSIONS There is significant correlation between all three test procedures and the image analysis Table III Normalized Mean Values for Roughness and Skin Moisture Evaluations From 14 Skin Creams (Study 2) Product Skin Roughness, no. moisture image analysis 1 108.87 86.76 2 107.28 93.38 3 110.97 92.76 4 119.10 89.97 5 100.96 103.33 6 120.47 89.71 7 113.76 94.67 8 111.07 94.84 9 109.76 92.05 10 99.77 76.07 11 107.84 97.25 12 109.66 95.39 13 117.78 90.03 14 112.04 95.54
Purchased for the exclusive use of nofirst nolast (unknown)
From: SCC Media Library & Resource Center (library.scconline.org)