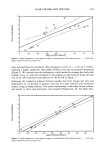
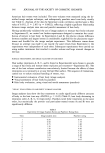
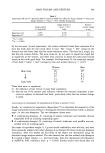
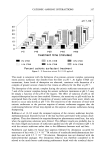
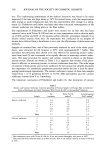
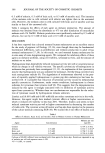
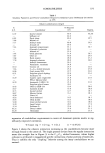
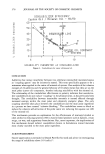
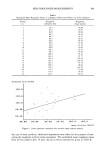
346 JOURNAL OF THE SOCIETY OF COSMETIC CHEMISTS American hair tresses were included. The tress volumes were measured using the de- scribed image analysis technique, and subsequently panelists rated tress body visually (see Table I). Analysis of the data by Spearman's rank correlation method gave a Rho value of 0.952, Z = 2.855 (p = 0.0022), reflecting a highly significant relationship between image analysis tress area and panelist assessment of hair body. Having satisfactorily validated the use of image analysis to measure hair body (volume) in Experiment II, we carried out further experiments designed to examine the contri- bution of texture to hair body. In Experiments I and II, the relative volume difference between smallest and largest tresses is considerable: eightfold for the planimeter exper- iment and fourfold for the image analysis experiment. This difference comes about because no attempt was made to use exactly the same tresses from Experiment I the experiments were independent of each other. Subsequent experiments were carried out using surface treatments that resulted in smaller volume and large textural changes to the hair. SURFACE TREATMENTS AND IMAGE ANALYSIS OF HAIR BODY Hair surface treatments A, B, C, and G (listed in Experimental) were chosen to provide a range of hair body and texture (three replicates per treatment--Experiment III). The size of the hair volume contribution was relatively limited because the effects of these treatments occur primarily at or near the hair fiber surface. The sequence of evaluations, carried out to ensure minimal handling of tresses, was: ß Instrumental evaluation of hair body (image analysis) ß Visual assessment of hair body by panelists ß Hair body evaluation, using visual and tactile assessment (panelists) "VISUAL" EVALUATION OF HAIR BODY VS IMAGE ANALYSIS Image analyzer data show the four treatments to confer significantly different amounts of body to the hair (one-way ANOVA p = 0.05) (Table II hair body decreasing in treatment order A, B, C, G respectively). Panelists rated these treatments in the same order, but statistically the protein- and particulate-treated tresses (A and B) were not significantly different. Table I Experiment II: Image Analysis Ratios and Panelists' Rating Data Tress Image analysis ratio Panelists' rating 1 O.5O O.95 2 O.58 1.55 3 0.75 1.80 4 1.16 3.7O 5 1.30 4.9O 6 1.48 5.65 7 1.08 5.35 8 1.44 6.40 9 1.61 7.50 10 1.90 9.05

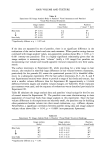
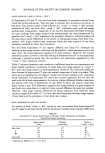
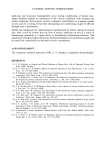
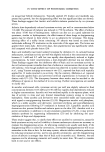
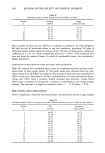
HAIR VOLUME AND TEXTURE 347 Table II Experiment III: Image Analysis Body vs Panelists' Visual Assessments and Panelists' Visual-Plus-Textural Evaluation Image analysis Panelists Panelists body (ratio) (visual body) ("visual + feel") Most body A* (1.51) A I A* 4/ B* (1.36) B B I C* (1.04) C* C Least body G* (0.53) G* G* * Significantly different at p = 0.05 level. If the data are separated by sex of panelist, there is no significant difference in the evaluations of the twelve female and nine male assessors. When panelist rating data are correlated with image analyzer values, non-parametric analysis shows Rho = 0.85, p 0.001 (twenty-one panelists). This is a highly significant relationship given that the image analyzer is measuring tress "volume" (really a 2-D image) but panelists are incorporating true volume and visually apparent textural components into their assess- ments. The surface treatments in Experiment III, while providing for a wide range in hair texture, also resulted in relatively large differences in hair volume between treatments, particularly for the pomade (G) versus the quaternized protein (A) (a threefold differ- ence). In a subsequent experiment (IV) the hair surface treatments, B, C, D, E, and F (see Experimental section) were chosen to provide a range of hair body and texture, but with a smaller volume difference than for Experiment III (approximately a 1.6-fold difference between largest and smallest volume changes see Table III). Three replicates per treatment were used, and the sequence of evaluations was as described previously for Experiment III. Table III tabulates the image analysis data and panelists' visual ratings for the five sets of treated tresses for Experiment IV. The panelists were more discriminating in their assessment of visual hair body than image analysis in this experiment. Since the hair volume differences in this experiment are relatively small, the panelists may be building other parameters besides volume into their visual evaluations, e.g., stiffness, dryness. Nevertheless, a significant correlation between panelist rating data and image analyzer volume values shows Rho = 0.94, p = 0.0001 (non-parametric Spearman). Table III Experiment IV: Image Analysis Body vs Panelists' (Visual Body) Treatment Rankings Image analysis Image analysis Panelists (body) (hair body ratio) (visual body) Most body Least body D* 1.08 -+ 0.04 D* E I 0-95+0.13 E I B 0.95 --- 0.07 B F I 0.71 --- 0.13 F* C 0.65 - 0.16 C* * Significantly different at p = 0.05.
Purchased for the exclusive use of nofirst nolast (unknown)
From: SCC Media Library & Resource Center (library.scconline.org)