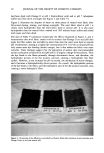
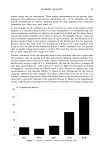
78 JOURNAL OF THE SOCIETY OF COSMETIC CHEMISTS MATERIALS AND METHODS A commercially available cream of known composition was used for the study. Raw materials of its composition were obtained from production inventories and were used as received. ComeIts of the raw materials were prepared in formulation ratios by heating to liquefaction, mixing, and cooling to room temperature. A Ferranti-Shirley cone and plate viscometer was used to determine the rheology of the cream. Unless otherwise specified, samples were tested with the instrument in low gear using the 7-cm truncated cone, a 60-sec sweep time, and the 2 X scale expansion on the recorder. A shear rate range of 0-164 sec- • was achieved with these instrument set- 0 ø tings. Measurements were obtained at 25 ø, 3 , 35 ø, and 40øC with an accuracy of + 0. IøC. Room temperature samples were loaded onto the plate of the viscometer with a 3/4-inch-wide teflon spatula and gently spread evenly. The sample quantity was such that a small ridge of cream appeared at the edge of the cone upon raising the plate. Sample size was verified by preliminary testing of larger and smaller quantities and observing for rheogram irregularities. Prior to beginning testing, samples were allowed to equilibrate until the temperature indicator linked to the thermocouples in the plate returned to the test temperature. Equilibration time increased with increasing test temperature. Measurements were taken from triplicate samples obtained from the sur- face and center of the jar. The rheograms presented in Figure 1 are from surface samples and are representative of the other rheograms with respect to shape and shear stress magnitude. Samples were examined with a Zeiss Universal microscope using polarized light and a 250x magnification. The melting behavior of the cream and its raw materials was observed using a Merrier FP82 hot stage with photomonitor at a heating rate of 5ø/ minute over the range of 25øC to slightly above the melting point. The melting point was defined as the temperature at which a thermal arrest appeared in the photomonitor recording and/or the temperature at which the crystals liquefied and flow began. Sam- ples were monitored both visually and with the photomonitor. Creams were monitored directly from the initial slide preparation. However, in order to obtain a thin film suitable for microscopy, samples of cetyl palmirate (Cutina CP ©, Henkel), Lexemul AR © (Inolex), and their comelt required premelting on the slide prior to monitoring their melting behavior. Photomicrographs of the cream, raw materials, and their comeIt were obtained initially and at various points during the melting transition. The particle sizes of the cream were too small to photograph adequately at 250x, which is the maximum focusable mag- nification with the hot stage. Therefore, a Sensortek TS-4ER thermal microscope stage was used to photograph the cream at 500 x magnification. Using this apparatus, cream samples were equilibrated and maintained at key temperatures identified in the hot stage studies. RESULTS AND DISCUSSION RHEOLOGY 0 ø The rheograms of the cream at 25 ø, 3 , 35 ø, and 40øC are shown in Figure 1. As is apparent, the overall shape of the rheograms remains the same, but the rheograms shift

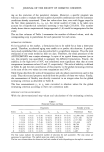
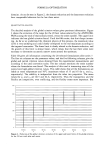
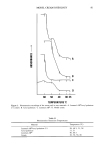
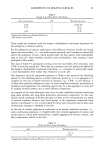
MODEL CREAM RHEOLOGY 79 160 120 25 øC 40• /'//"'/' •%,,.• ]primary .} spurs r ,,'"/,d" I I I I I 532 1064 1596 2128 2660 SHEAR STRESS (dynes/cm 2) Figure 1. Cream rheograms at 25 ø, 3 , 35 ø, and 40øC. to the left and the size of the hysteresis loop generally decreases as the temperature increases. The most predominant thermal effects are seen in the up curves of the rheograms, while the down curves vary relatively slightly. This would suggest that the rheology of the down curve is dominated more by mechanical stresses than by thermal stresses. Closer examination of the up curves reveals a characteristic inflection after the spur formation. The shear stress associated with this inflection shall be termed the inflection yield value, 'ri. As the temperature increases from 25-35øC, the inflection point shifts to a lower shear rate and becomes less defined. The associated 'r i value also decreases. Table I lists the inflection yield values and associated shear rates for each temperature. At 40øC the inflection totally disappears. As will be seen in the section on structure determination, the inflection point can be attributed to a secondary network Table I Inflection Yield Value Parameters Temperature Inflection yield value Inflection shear rate (øC) (dynes/cm 2) (sec- •) 25 1715 96 30 1569 82 35 1369 71 40 -- --
Purchased for the exclusive use of nofirst nolast (unknown)
From: SCC Media Library & Resource Center (library.scconline.org)