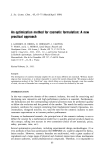
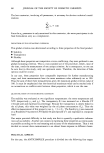
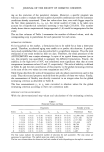
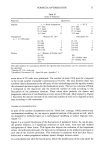
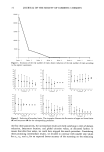
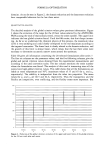
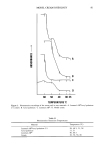
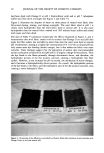
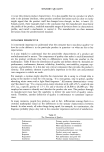
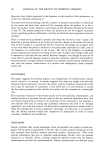
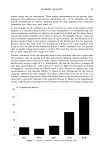
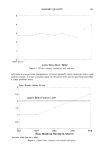
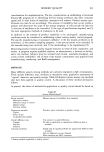
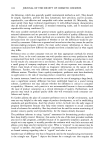
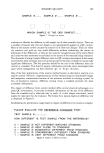
FORMULA OPTIMIZATION 71 Table II Scales of Properties Properties Quotations Stability Transparency Y3 = L * Oily phase Fluidity y• = Room temperature [0-1 day] 0 [1-5 days] 3 [5-10 days] 7 • 10 days 35 Measure of L (%)a [0-70] 1 [70-80] 2 [80-85] 5 [85-90] 8 [90-100] 10 Y4 = Measure of fluidity (cps) b [0-25] [25-50] [50-75] •75 Y2 = 50ø C [0-1 day] 0 [1-5 days] 6 [5-10 days] 13 • 10 days 65 Oily phase (%) [5-10] [10-20] [20-3O] [30-4O] [40-5O] 100 105--fluidity value 95--fluidity value 0 1 2 5 8 10 This table explains the transcription between the experimental measurements the algorithm. • Minolta CT 210•Lab scale. b Brookfield Viscometer LVT--Speed 60 rpm--Spindle n ø 1. and the quotations used by seven series of 20 trials were performed. The number of trials (140) must be compared to the initial number of possible combinations (233,016). The ratio between these two numbers clearly demonstrates the efficiency of this methodology and the rapidity toward the estimated optimum region for this formulation study. The last two columns of Table I correspond to the maximum and the restricted number of trials according to the fluctuation of the parameter domains. These values show perfectly the drastic and progressive reduction of combinations at every series of 20 trials. More explicitly, Figure 1 illustrates the massive decrease of the restricted number of trials to be explored at each step according to the constraints. GRAPHICAL INTERPRETATION In spite of the number of parameters and the "block box" strategy, which prevents any mathematical modeling, we can expect a graphical analysis of the process as well, which we obtained by methods based on a mathematical modeling as surface response tech- niques (7). Figure 2 is a typical illustration of the fluctuations of parameter limits. As can be seen, the general tendency is a significant reduction at each series, with rare and isolated enlargements of these limits. This figure also depicts the evolution of the barycenter values. As indicated previously, the barycenter corresponds to the predicted optimum at each step of the iterative procedure. This evolution is consistent with the limit fluctu- ations and is rather progressive without drastic changes between series. It is remarkable that after the fourth series, before the modification of the step values for

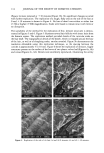
72 JOURNAL OF THE SOCIETY OF COSMETIC CHEMISTS 250000 200000 150000 100000 50000 I I 1 Series 1 Series 2 Series 3 Series 4 Series 5 Series 6 Series 7 Series 8 Figure 1. Evolution of the real number of trials: drastic reduction of the real number of trials according to the explicit constraints. i i t i i i i Parameter xl •o lO s o S2 sa S7 S• Parameter x2 i • i i t i i i sa sa sn as s• s? s• Parameler x3 m (m ß ß ß Parameter x4 Parameter x5 s? s• 14 lO 4 Sl sa_ s? Parameler x6 Figure 2. Evolution of boundary limits. The six graphs illustrate the fluctuation of upper and lower limits (©) and barycenter (m) for the corresponding parameter. the first three parameters, the intermediate results are really satisfying in term of domain reduction, barycenter location, and global criterion values, as discussed further. It means that after four series, we could have stopped the search procedure. Considering these promising intermediate results, we decided to continue with smaller step values for x•, x 2, and x 3 for an expected better accuracy of the screening on the remaining
Purchased for the exclusive use of nofirst nolast (unknown)
From: SCC Media Library & Resource Center (library.scconline.org)