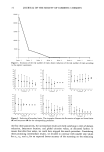
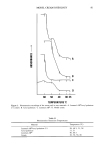
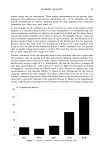
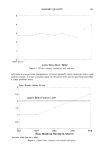
FORMULA OPTIMIZATION 69 1. RANDOM SAMPLING OF THE FIRST SERIES OF 20 TRIALS The exploration of the space parameters is devoted to the algorithm that determines the six parameter values for each of 20 points (point = trial) in agreement with all the constraints. 2. EXPERIMENTATION Each point corresponds to a trial to be carried out from which the estimating criterion is measured. Therefore, we obtained 20 estimating criterion values that were put into the program. 3. ANALYSIS AFTER THE FIRST SERIES OF TRIALS The algorithm calculates a weighted centroid (so-called barycenter), which mainly takes into account the best trials according to the estimating criterion. The concrete meaning of this barycenter is the best approximation of the optimum condition at this stage. A statistical analysis based on the dispersion of the 20 values for the six parameters leads to a reduction of the boundary limits. Every new domain of the six parameters is centered on the corresponding barycenter value. 4. CONVERGENCE TOWARD THE OPTIMUM For the second series and those following, the algorithm randomly defines 20 other trials in the six new parameter domains, and the iterative procedure is performed on the three previous stages with only a few modifications until a stopping criterion is reached. In this algorithm, it is very easy to give a graphical interpretation of the results by analyzing the fluctuations of the boundary limits and the corresponding barycenter values, as we can see in Figure 2. RESULTS AND DISCUSSION BOUNDARY LIMITS AND STEPS The lower and upper limits of the six parameters for the first series are respectively: 5 •x• • 50 0 •x 2 • 30 30 •x 3 • 80 0 • X 6 • 20 1 • X 5 • 20 0 • X 6 • 20 For the parameters x• to x 3, their steps for the four first series were set at 5.0. These values progressively decreased to 2.5 for the fifth series (in order to refine the optimum region) and finally to 0.5 for the two last series (in order to avoid artefacts due to constraint conditions involving subsets of parameters with different steps). This non- standard modification of step values can be argued either by theoretical consideration (higher accuracy) or by technical consideration (artefacts). The discretization of parameter values led to a finite number of possible values from which a theoretical number of combinations could be calculated at each series, depend-

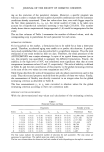
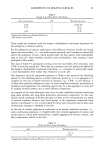
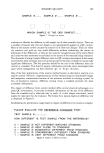
70 JOURNAL OF THE SOCIETY OF COSMETIC CHEMISTS ing on the evolution of the parameter domains. Moreover, a specific program was written in order to evaluate the real number of possible combinations with the constraint conditions already mentioned. These last values show that, even with bigger steps for the first three parameters (x•, x 2, x3), the initial number of trials to be taken into account for a hypothetical systematic screening is very high (233,016). This number clearly shows that an experimental design approach (1,6) would be inappropriate for this study. The six first columns of Table I summarize the number of allowed values, with the corresponding step in parentheses for each parameter for each series. ESTIMATING CRITERION To be launched on the market, a formulation has to be stable for at least a three-year period. Therefore, accelerated aging tests enable us to predict this duration. A prelim- inary study established that a ten-day period led to a significant response. Thus the total evaluation of one series needed at least ten days. Therefore, the serial procedure of the ANTICOMPLEX was a major advantage. In spite of its typical binary response (yes or no), this property was quantified to segregate the different formulations. Finally, the stability at the high level of 50øC was considered more significant than that at room temperature (maximum values 65 and 35, respectively). The scale of stability is defined in Table II, and the real contribution of this property to the global estimating criterion is the sum of the two values (at room temperature and 50øC). Table II also describes the scales of transparency and oily phase concentration used in this study. Thus this second property resulted from the product of these two values. Finally, the measurement of fluidity was directly converted in an integer value for the global estimating criterion as described in Table II. The four measurements y• to Y4 were converted to absolute values for the global estimating criterion according to their own conversion scale. EFFICIENCY OF THE ANTICOMPLEX With the above-mentioned step values and calculations of the estimating criterion, Table I Permitted Values and Steps Parameters Number of trials Series x 1 x2 x3 x4 x5 x 6 Theoretical Real 1 10 (5.0) 7 (5.0) 11 (5.0) 91 (0.5) 39 (0.5) 41 (0.5) 112,001,930 233,016 2 6 (5.0) 5 (5.0) 6 (5.0) 67 (0.5) 28 (0.5) 14 (0.5) 4,727,520 44,139 3 7 (5.0) 3 (5.0) 5 (5.0) 58 (0.5) 27 (0.5) 13 (0.5) 2,137,590 24,565 4 6 (5.0) 2 (5.0) 7 (5.0) 11 (0.5) 21 (0.5) 11 (0.5) 213,444 2,475 5 11 (2.5) 3 (2.5) 14 (2.5) 2 (0.5) 16 (0.5) 6 (0.5) 88,704 1,354 6 48 (0.5) 1 (0.5) 68 (0.5) 1 (0.5) 15 (0.5) 1 (0.5) 48,960 714 7 33 (0.5) 1 (0.5) 44 (0.5) 1 (0.5) 11 (0.5) 1 (0.5) 15,972 362 8 15 (0.5) 1 (0.5) 11 (0.5) 1 (0.5) 9 (0.5) 1 (0.5) 1,485 92 The first values indicate the permitted number of solutions for each parameter. The step values are mentioned in parentheses. The eighth series was simply calculated. The last two columns show the theoretical and real number of trials (depending on the explicit constraints).
Purchased for the exclusive use of nofirst nolast (unknown)
From: SCC Media Library & Resource Center (library.scconline.org)