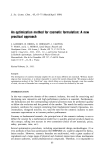
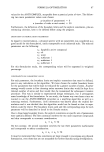
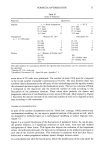
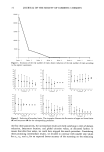
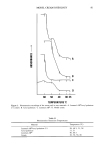
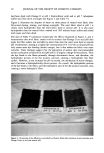
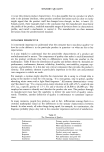
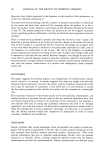
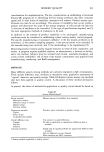
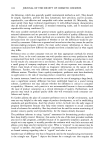
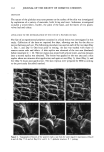
100 JOURNAL OF THE SOCIETY OF COSMETIC CHEMISTS MEAN RATING 4 lots Figure 2. Moisturizer quality drift: sensory difference ratings. of 1.5 is established (Figure 6), and the procedure to monitor it is a sensory skinfeel evaluation. While the availability and use of sensory methods facilitated the problem solving, it is vlean Scores 2.5 1.5 0.5 i L I OCT Oct/1992-Feb/1998 NOV DEC JAN FEB Figure 3. Tackiness ratings.

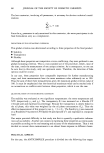
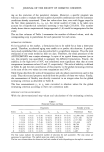
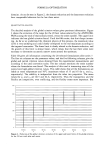
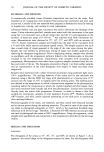
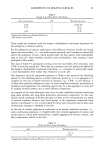
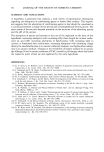
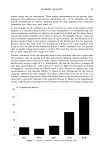
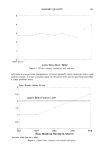
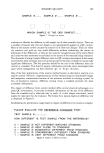
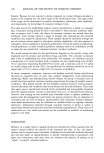
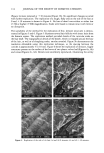
SENSORY QUALITY 101 Mean Score Lots-Nov/Dec 1992 Figure 4. Off-odor intensity: moisturizer with sunscreen. still learn-as-you-go crisis management. A better approach, more consistent with a total quality concept, is to get consumer input on tolerance limits and set specifications before a costly problem arises. Odor Grade--Mean Score 2.5 1.5h I 0.5l 0 Upper Specification Limit OCT NOV DEC JAN Raw Material Receipts/Month October 1992-February 1993 Figure 5. Control chart: sunscreen raw material odor grades. FEB
Purchased for the exclusive use of nofirst nolast (unknown)
From: SCC Media Library & Resource Center (library.scconline.org)