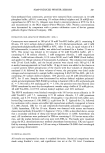
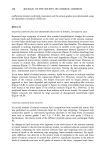
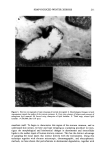
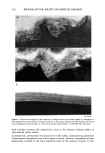
206 JOURNAL OF THE SOCIETY OF COSMETIC CHEMISTS ELECTRON MICROSCOPIC ANALYSIS Stratum corneum tape strippings were fixed for eight minutes in 0.1 M sodium caco- dylate buffer, pH 7.4, containing ruthenium tetroxide (0.2%), dehydrated through a series of alcohol solutions to propylene oxide and embedded in TAAB resin (TAAB Lab., Aldermaster, UK). Ultrathin sections were stained with lead citrate and viewed in a JEOL 100 CXII transmission electron microscope. STRATUM CORNEUM LIPID ANALYSIS All solvents were chromatography grade. Stratum corneum lipids were extracted from corneocytes using chloroform methanol (2:1) for two hours at RT, the solvent was aspirated from the corneocytes and dried under nitrogen, and the lipids were redissolved in chloroform. Stratum corneum lipid fractions were first chromatographically separated into their individual lipid classes and from tape stripping contaminants using solid- phase extraction columns. Briefly, the lipids were successively eluted from aminopropyl- bonded phase columns (Bond-Elut, Anachem Ltd, UK), using hexane to remove tape contaminants (neutral lipids were also lost in this fraction) hexane:ethylacetate (85:15) to elute cholesterol chloroform:isopropanol (2:1) to elute ceramides and finally, meth- anol:acetic acid (98:2) to elute fatty acids. The eluates were dried and redissolved in chloroform methanol (2:1). The isolated ceramide fractions and the combined choles- terol and fatty acid fractions were then quantitated separately by high-performance thin-layer chromatography (HPTLC). The HPTLC methodology was performed essen- tially according to Wertz et al. (34,35) and Ponec et al. (36), using silica gel 60 HPTLC plates (20 X i0-cm Merck, UK). Briefly, the ceramide and the cholesterol together with fatty acid fractions were chromatographically separated on separate plates by three sequential elutions of chloroform:methanol:acetic acid ( 190:9:1). After chromatographic separation, the lipids were visualized on the HPTLC plates by general degradative charring using an acidic copper sulphate solution (10% copper sulphate 8% phosphoric acid solution) and charring to 160øC for 20 minutes. After cooling, the lipid bands were quantified by reflectance densitometric scanning at 420 nm, using a Shimadzu CS-9000 flying spot densitometer (Shimadzu, Japan). Lipids were identified by their co- migration with cholesterol, palmitic acid, and N-stearoyl sphingosine standards (Sigma Chemical Company, Poole, UK). Ceramide subclasses were also identified by the rf values from the literature (21,34-36) together with their chromatography characteristics similar to those of the standard ceramide. Ceramide one was further identified by its change in chromatographic mobility after alkali hydrolysis (34) and by co-migration with chemically synthesized ceramide one, the identity of which had been verified by mass spectroscopy and proton-NMR. The mass of each stratum corneum lipid was determined from the appropriate series of standards chromatographed on each plate. Triglycerides and other neutral lipids, together with cholesterol sulphate levels, could not be determined, as tape-stripping contaminants co-migrated with these lipids during chromatography. To allow inter-person comparisons, the mass of each lipid fraction was normalized to the amount of stratum corneum removed by tape stripping. The amount of stratum cor- neum was estimated by quantification of the detergent-soluble protein of the corneocytes extracted under reducing conditions (37). Briefly, following aspiration of the chloro-

SOAP-INDUCED WINTER XEROSIS 207 form-methanol from corneocytes, proteins were extracted from corneocytes in 10 mM phosphate buffer, pH 8.0, containing 1% sodium dodecyl sulphate and 20 mM [•-mer- captoethanol at 60øC for 2 h. Aliquots were dried in microtiter plates at 85øC for 24 h and reconstituted in the BCA reagent (Pierce-Wariner, UK). Protein concentrations were determined by comparison with a protein calibration curve of bovine gamma globulin (Sigma Chemical Company, UK). EXTRACTION AND ANALYSIS OF DESMOGLEIN 1 (DSG 1) Corneocytes were extracted in 500 p•l of 50 mM Tris-HC1 buffer, pH 9, containing 8 M urea, 2% (w/v) sodium dodecyl sulphate, 5% (v/v) [3-mercaptoethanol, and 2 mM phenylmethylsulphonylfluoride (PMSF) at 90øC. After 15 min, an equal volume of 0.5 M iodoacetamide, in extract buffer, was added and incubated for a further 15 min at 90øC. The extract was diluted in 20 volumes of 50 mM Tris-HCL buffer, pH 7, containing 0.5 M sodium chloride, 1 mM manganese chloride, 1 mM magnesium chloride, 1 mM calcium chloride, 0.1% triton X100, and 2 mM PMSF (ConA buffer), and applied to 200-p•l columns of Concanavalin A-sepharose. The columns were washed with 20 ml ConA buffer, and the bound proteins were eluted with 500 p•l 0.5 M o•-methyl mannopyranoside in ConA buffer. 10 p•g of casein was added to the eluates as a carrier protein before precipitation of the eluates with four volumes of chloroform: methanol (1:4) followed by three volumes of water the precipitate was dried under nitrogen and reconstituted in sample buffer comprising 0.0625 M Tris-HCL, pH 6.8, containing 2% sodium dodecyl sulphate, 10% glycerol, and 20 mM dithiothreitol at 60øC, for 15 min. Samples were fractionated by sodium dodecyl sulphate polyacryl- amide gel electrophoresis (SDS PAGE) according to Laemmli (38) in 8% acrylamide gels (C = 3.3%) with a 4% stacking gel (C = 3.3%) the proteins were then blotted onto PDVF membrane by semi-dry electrophoretic transfer using a buffer of 39 mM glycine, 48 mM Tris-HCL, 0.0375% sodium dodecyl sulphate, and 10% methanol. The PDVF membranes were blocked overnight with 5% bovine serum albumin in 50 mM Tris-HCl, pH 7.5, containing 0.15 M sodium chloride, 2.5 mM potassium chloride, and 0.1% Tween 20 (TBS-tw). Desmoglein 1 was detected with rabbit anti- bovine Dsgl antiserum (1:100 R882.2 a gift from Dr. T. Egelrud) for 2 h, followed by incubation with a mouse anti-rabbit IgG monoclonal antibody conjugated to biotin (1:1,000 Zymed, UK) for 1 h and streptavidin-horseradish peroxidase conjugate (1: 1,000 Amersham, UK) for 30 min. Keratin was detected with mouse anti-keratin monoclonal antibody (Clone K8.13 Sigma) at 1: 50 to 1:200, as described above, except that a secondary antibody of sheep anti-mouse IgG-biotin (1:1,000 Amersham) was used. All incubations were performed in TBS-tw containing 0.1% bovine serum albu- min, and the washes between each step were with TBS-tw. The bands were visualized using the ECL chemiluminescence method (Amersham International, UK) and quanti- fied by scanning densitometry at 530 nm using a Schimadzu CS-9000 dual wavelength spot scanning densitometer. STATISTICAL ANALYSIS All results are represented as mean +-- standard deviation. Statistical comparisons were made using Student's t-test, and significance was set at the 5% level. Correlation
Purchased for the exclusive use of nofirst nolast (unknown)
From: SCC Media Library & Resource Center (library.scconline.org)