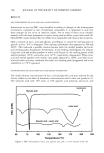
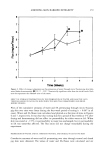
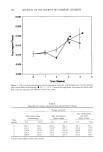
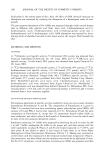
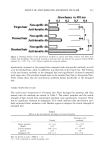
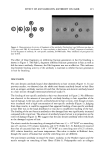
168 JOURNAL OF THE SOCIETY OF COSMETIC CHEMISTS RESULTS DSC COMPATIBILITY OF AHAs AND AHAs AND EXCIPIENTS Interactions, as seen by DSC, were classified according to changes in the thermograms of mixtures, compared to that of individual compounds. It is important to note that these changes do not occur in isolation rather, two or more of them occur simulta- neously, with the most prominent occurence being used to define a particular result (8). Overall DSC results showed that the AHAs were compatible with most of the excipients. Only a mixture of lactic acid and glycolic acid (Figure 1) caused the melting point of glycolic acid at 79øC to disappear. New melting endotherms then appeared at 200 and 260øC. This indicated a possible reaction because both the methyl paraben and lactic acid melting peaks disappeared. Furthermore, in the melting thermogram of a mixture of glycolic acid and methyl paraben or sorbic acid (Figure 2), the melting points of the methyl paraben, 126øC, and sorbic acid, 135øC, respectively, disappeared. When lactic acid and methyl paraben were mixed, extra peaks appeared at 260øC, and when lactic acid and sorbic acid were combined the sorbic acid melting peak disappeared and a new endotherm at 179øC appeared. DETERMINATION OF RATE CONSTANTS AND KINETIC PARAMETERS The initial solution concentrations of lactic acid and glycolic acid were selected for the kinetic studies on the basis of maximum concentrations used in skin care products (1). The solutions used were 10% lactic or 10% glycolic acid solutions, and lactic acid Glycolic acid I} ic acid Lact ! ! Endothermic Lactic acid Glycolic acid + Lactic acid i i i 50 75 100 125 150 175 200 Temperature (øC) Figure 1. DSC thermograms of lactic acid, glycolic acid, and a 1:1 w/w mixture of the two. 225

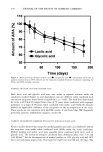
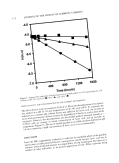
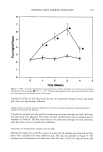
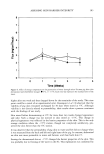
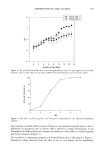
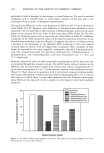
STABILTY OF LACTIC AND GLYCOLIC ACIDS 169 Endothermic Methyl paraben ß . Sorbic acid i i i I i i 50 75 100 125 150 175 200 225 Temperature (øC) Figure 2. DSC thermograms of methyl paraben, sorbic acid, and 1'1 w/w mixtures of glycolic acid and these preservatives. solution buffered at pH 3.8 with sodium lactate. The kinetic parameters describing decomposition were determined from appropriate analysis results obtained from cali- brated methods. Calibration data for analytical methods are listed in Table I. For all the analysis methods used, the resolution values (Rs) between the compounds and their main degradation products were greater than 1.3, and calibration graphs (Table I) showed excellent linearity in the concentration ranges of interest. The precision of the HPLC and UV methods were obtained by repetitive determinations (n -- 5) of standard solutions, and the relative standard deviations were found to be 1.3 + 0.3%. The relative standard deviations for parallel degraded samples (n = 5) varied by 1.5 + O.4%. The kinetics of degradation were investigated at elevated temperatures (Figure 3) since the decomposition rates of lactic acid, glycolic acid, methyl paraben, and sorbic acid at room temperature (25øC, Tables II, III) were too slow to obtain kinetic data within a reasonable time. At the conditions studied, the decompositions of these compounds followed apparent first-order kinetics because the mean correlation coefficient for all calculations was above 0.980. The apparent first-order reaction rate constants were determined from the slopes of the lines obtained by plotting the natural logarithm of the residual concentration versus time (Figure 4). Because the reaction mechanisms remained unaltered, the predicted rate constants were used to calculate shelf lives at 25øC. Predicted shelf lives and real time stability data at 25øC are listed in Tables II and III.
Purchased for the exclusive use of nofirst nolast (unknown)
From: SCC Media Library & Resource Center (library.scconline.org)