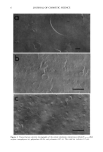
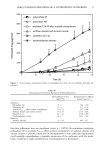
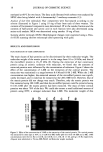
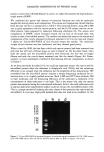
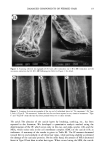
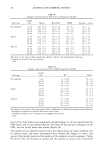
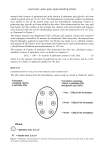
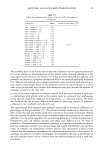
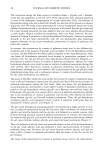
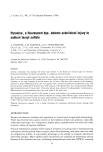
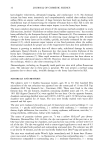
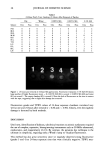
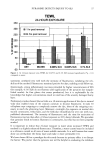
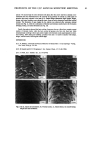
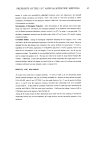
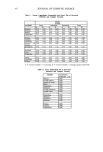
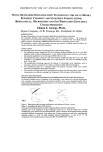
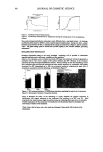
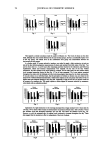
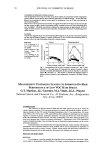
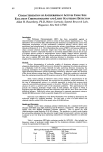
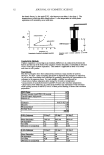
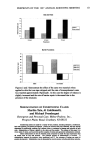
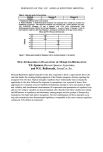
DAMAGED COMPONENTS OF PERMED HAIR 19 .,. Figure 4. Scanning electron micrographs of the hairs after extraction: (a) 2 M 2-ME extraction and (b) successive extraction by 0.4 M 2-ME following (a). Refer to Figure 1 for detail. O rb c 11•711 14KV X700 49um 11•708 14K¾ X50e 6eum Figure 5. Scanning electron micrographs of the tip end of individual hairs: (a) "No treatment," (b) Type I, and (c) Type II. "No treatment" means the hair has not been exposed to any chemical treatment. "Type I" and "Type II" mean the hair has been permed every two or three months. The cuticle. The abrasion of the cuticle layers by brushing, combing, etc., has been reported in the literature. We developed a quantitative analysis method using the determination of the IP, which exists only in the exo- and endo-cuticles (18), and the MEA, which exists only in the cell membrane complex (CMC) of the cuticle (19), as indicators. A summary of the results is given in Table III. The IP amount decreased toward the tip end similarly in all three hair types, while perming slightly accelerated the damage of the cuticular proteins. On the other hand, the amount of MEA decreased faster in Type II hair than in other hair types. When viewed using the SEM, the cuticle

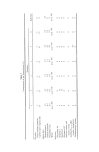
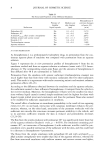
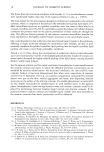
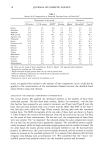
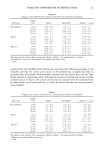
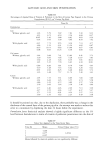
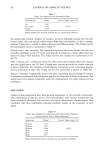
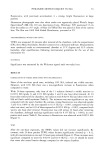
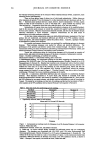
20 JOURNAL OF COSMETIC SCIENCE Table II Changes in the Contents of Each Fraction Toward the Tip End a Length Hair type (cm) Matrix Microfibril HMW Residue + cuticle No treatment 0-10 28.2 _+ 2.3 b 43.4 _+ 3.3 6.9 -+ 1.3 10-20 26.1 _+ 2.0 46.0 _+ 2.8 6.6 _+ 0.7 20-30 24.6 _+ 1.4 45.9 _+ 3.1 7.9 -+ 0.5 30--40 22.6 _+ 2.6 43.6 _+ 4.4 8.3 _+ 2.3 Type I 0-10 26.1 _+ 0.9 44.7 _+ 3.0 6.5 -+ 1.9 10-20 23.6 _+ 1.3 42.4 _+ 5.3 8.5 _+ 2.0 20-30 23.9 -+ 2.3 33.3 -+ 3.3 12.3 _+ 3.3 30--40 22.4 _+ 1.1 24.0 _+ 4.2 18.1 _+ 3.9 Type II 0-10 25.7 _+ 1.2 46.3 _+ 3.9 9.7 -+ 1.9 10-20 22.9 _+ 2.3 45.8 _+ 2.8 10.4 _+ 2.4 20-30 23.4 _+ 2.5 39.2 -+ 3.3 13.9 -+ 3.1 30--40 21.6 _+ 3.3 26.9 -+ 5.3 8.2 _+ 0.3 21.5 _+ 1.7 21.4 _+ 1.6 21.6 _+ 2.2 25.5 _+ 2.9 22.7 _+ 2.0 25.5 _+ 1.4 30.5 _+ 1.7 35.5 -+ 3.4 18.3 _+ 1.8 21.0 _+ 1.4 23.4 _+ 2.6 33.3 -+ 2.5 All values are the mean of three experiments. Refer a Expressed as w/w% of the total recovery. b_+SD. to Figure 1 for experimental conditions. Table III Changes in the Amount of IP and MEA Toward the Tip End Length Hair type (cm) IP • MEA 3 No treatment 0-10 1.1 _+ 0.18 c 56 -+ 3.9 10-20 1.0 _+ 0.12 42 _+ 4.5 20-30 1.0 _+ 0.12 38 _+ 4.4 30•40 0.9 _+ 0.23 36 _+ 5.6 Type I 0-10 1.2 _+ 0.02 52 _+ 1.9 10-20 0.8 _+ 0.14 42 _+ 3.3 20-30 0.7 _+ 0.19 41 _+ 5.2 30--40 0.4 _+ 0.15 3 ! -+ 3.4 Type II 0-10 0.7 _+ 0.22 56 _+ 3.8 10-20 0.7 _+ 0.13 29 _+ 3.3 20-30 0.5 _+ 0.19 17 _+ 1.7 30--40 0.2 _+ 0.19 12 _+ 2.2 All values are the mean of three experiments. Refer to Materials and Methods for experimental conditions. • Isopeptide is expressed as residues/1000 amino acids of hair. a 18-methyl-eicosanoic acid is expressed as micrograms/100 mg hair. c_+ SD. layers of the Type II hair were significantly abraded (Figure 5c). It was reported that the CMC plays a role in intercellular adhesion. The split-end hair was not so damaged on the CMC, and the cuticle layers may remain (Figure 5b). The oxidation of each component. Cysteic acid is the major product of cystine oxidation due to various causes, and many investigators have studied the changes in cysteic acid content. Our method permitted the analysis of the oxidation of each component. Tables IV and V show the decrease in cystine and the increase in cysteic acid. It has been
Purchased for the exclusive use of nofirst nolast (unknown)
From: SCC Media Library & Resource Center (library.scconline.org)