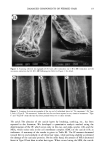
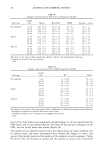
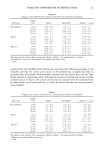
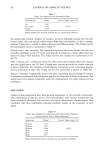
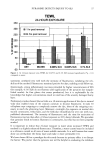
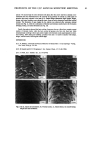
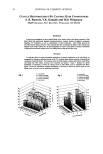
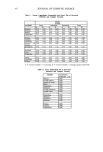
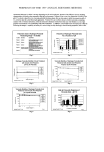
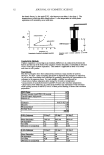
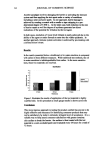
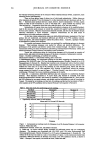
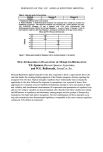
PREPRINTS OF THE 1997 ANNUAL SCIENTIFIC MEETING 45 amount of residue and spreadability), after-feel (stickiness, gloss and slipperiness) and over-all properties (liking, absorbency and softness ) from 1 (the worst) to 9 (the best) according to ASTM Committee E-18 Guidelines for the Descriptive Analysis of Skin Feel. The means and standard deviations of each attribute was calculated. Determination of Rheologleai Properties: After determination of the optimum stress-sweep range which was within 0.05 -100 Pascals, the theological properties of the emulsions were measured with a CVO 50 Bholin Instruments Rheometer, software version 4.5, at 25 o C by using a 1 mm gap width. The theological components measured were the phase angle, elastic (G') and viscous (G") moduli, complex viscosity and strain. Correlation Studies: Among the theological components measured, the loss tangent ( G'/G" * 100) was found to be the most represantative parameter to describe the flow properties of the creams. They were tabulated from the data obtained and correlated to the sensory attributes by using linear ( Y=AX+B ), logarithmic (Y=A+B*Ln(X)), exponential (Y=A*Exp(B*X)) and power (Y=AX•), equations, where X was either the oil concentration or the loss tangent, Y was the perceived attribute and A and B were the regression conslants. The probable fits were postulated and their resulting correlation coefficients (r2), were used to compare the goodness of fit. The data were fitted to the models by using Hewlett Packard 48G software. Additionally, a linear three-dimensional model which incorporated the weight fraction of oil, perceived attribute, and the loss tangent was tested by the use of Maple version 4.0 software and resulting correlation coefficients were also obtained in order to compare its fit. RESULTS AND DISCUSSION All creams were in the form of singular emulsions. As shown in Table I, the two dimensional models showed scattered correlations with only occasionally acceptable fits. Whereas, the three dimensional model, Z=Co+AX+BX, where Z was G'/G"*100. X was the weight fraction of oil , Y was the perceived attribute and C o, A and B were the regression constants, presented their relationship with most acceptable accuracy,Table II. In this model the correlation coefficients of 0.993 to 0.936 (eigt cases) demonstrate an excellent, and 0.768 to 0.738 (four cases) good correlations. Coefficients that change between 0.600 to 0.256 (three cases) are the measure of poor fit,(Table II) Among all the models tested, the three dimensional linear model was the most satisfying to describe the relationship between the perceived attributes, the weight fractions and the theological properties of the emulsions.

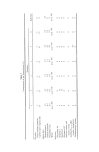
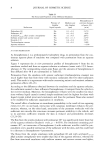
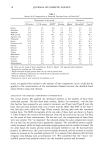
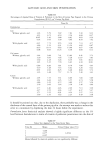
46 JOURNAL OF COSMETIC SCIENCE Table I: Linear, Logarithmic, Exponential and Power Fits of Perceived Attributes and Complex Viscosity Model Tested A ttrib u te Linear Logarithmic Exponential Power A B A B A B A B Firmness 0.75 -0.52 0.76 -0.49 0.79 -0.58 0.83 -0.57 Stickness 0.64 -0.69 0.61 -0.72 0.49 -081 0.46 -0.81 Peaking, -0.33 -0.34 -0.42 -0.34 -0.22 0.20 -0.31 0.24 Cohesivenes 0.15 -0.54 0.17 -0.64 0.26 -0.20 0.26 -0.29 Wetness -0.81 -0.18 -0.80 -0.14 -0.76 0.46 -0.72 0.48 Thickness 0.89 -0.19 0.88 -0.14 0.89 -0.63 0.92 -0.56 Absorbency -0.67 -0.38 -0.66 -0.40 -0.62 0.26 -0.62 0.24 A m o u n t o f 0.90 -0.12 0.91 -0.06 0.85 -0.66 0.91 -0.57 Residue Spreadability -0.90 -0.14 -0.90 -0.12 -0.92 0.42 -0.89 0.47 Stickiness 0.94 -0.04 0.93 0.06 0.91 -0.59 0.94 -0.32 Gloss 0.93 -0.03 0.94 0.02 0.85 -0.62 0.90 -0.57 Shpperiness -0.70 -0.29 -0.70 -0.29 -0.76 0.27 -0.71 0.29 Liking -0.75 0.04 -0.75 0.11 -0.73 0.53 -0.69 0.60 Absorbency -0.83 -0.14 -0.82 -0.11 -0.83 0.43 -0.80 0.48 Softness -0.88 -0.13 -0.87 `0.10 -0.88 0.45 -0.84 0.49 A: r 2 of perceived attribute vs. oil percentage, B: r 2 of perceived attribute vs. rheological property (Tan(y)*100). Table !!: Three Dimensional Fit of Perceived Attributes and Complex Viscosity Attribute Correlation coefficient Wetness 0.993 Overall Softness 0.978 Amount of residue 0,962 Gloss 0.962 SpreadaNlit¾ 0.958 Stickiness 0.950 Overall Absorbency 0.936 Overall Liking 0.936 Slipperiness 0.768 Thickness 0.756 Absorbency 0.745 Stickiness 0.738 Peaking 0.600 Firmness 0.388 Cohesiveness 0.256
Purchased for the exclusive use of nofirst nolast (unknown)
From: SCC Media Library & Resource Center (library.scconline.org)