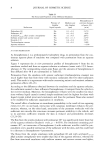
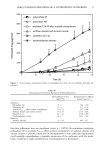
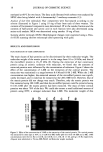
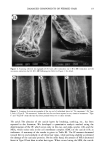
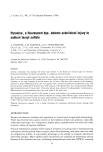
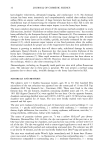
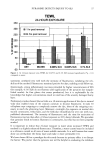
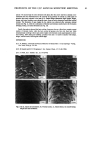
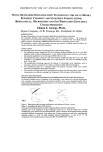
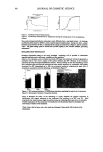
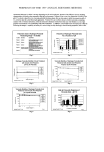
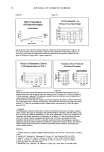
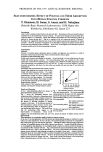
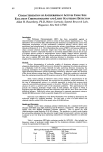
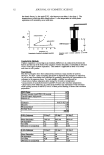
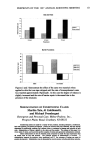
PREPRINTS OF THE 1997 ANNUAL SCIENTIFIC MEETING 61 As seen in Table 1 molecular weights obtained from SEC-Light Scattering are somewhat higher than the estimated literature ranges except for the peak i polymer which falls within the range. These differences may be due to individual drddc values differing from the bulk value used in the molecular weight calculations, the small scattering intensities for the aluminum polymers which can impact accuracy and the uncertainty of the literature values themselves. Further work is in progress to address the above issues. References 1. Antiperspirants and Deodorants edited by K. Laden and C. B. Felger Chapter 6, pp 163-178, Marcel Dekker (1989) 2. Markarian, H. and Rosenberg, A. H. U.S. Patent 4,818,512 (1989) 3. Rosenberg, A. H., et al European Patent Application 0653 203A1 (1995) 4. Callaghan, D. T., et al U.S. Patent 5,486,347(1996) 5. Antiperspirants and Debdorants, edited by K. Laden and C. B. Felger, Chapter 6, p 170, Marcel Dekker (1989) Elution Time Figure 1. Aluminum polymer distributions for ACH-323 using light scattering detection. Elution Time Figure 2. Aluminum polymer distributions for ACH-323 using RI detection. RAPID PREDICTION OF EMULSION STABILITY Gerd H. Dahms IFAC (Institute for Applied Colloidtechnology), Duisburg, Germany The prevalent method for testing the physical stability of cosmetic emulsions is storage at temperature. A disadvantage of this method is the long time interval between production of the sample and the observation of any visible phase separation that would indicate instability. This time interval sl•etcbes to several weeks. Methods employing rheological or conductivity measurements can prodict physical stability within 6 or 48 hours respectively after sample production, and with 100% reliability. Such methods thus offer the potential to greatly accelerate this part of the formulation development process. Rheoloeical Methods Physical instabilities such as creaming or coalescence are caused by flow phenomena in emulsions. Droplets which are unable to move through the continuous phase cannot flow together or move to the top or bottom of a container through the operation of Stokes' Law. The viscosity described by Stokes' Law is the "zero shear viscosity", i.e. the viscosity of an emulsion in the state where no sWucture breakdown has taken place. To be stable, oil-in-water emulsions need to display an infinite zero shear viscosity, i.e. to display a yield sl•ess. At very low shear rates, they behave more like an elastic solid than a viscous liquid. The forces applied to the continuous phase by the discontinuous phase due to gravity/buoyancy must be below the system yield stress. The yield sla'ess is due to slxucture set up in the continuous phase by theology modifiers or liquid crystalline gel networks. A cone-and-plate rheometer can be used in oscillation mode to extract the magnitude of the elastic forces operating within the emulsion G' (i.e. the extent to which the emulsion is behaving like a solid), and the magnitude of the viscous forces within the emulsion G" (i.e. the extent to which the emulsion is behaving like a Newtonian liquid). These two parameters can be measured across a range of temperatures. Essentially an oil-in-water emulsion will be stable so long as, at very low shear rates, the viscous forces are less than

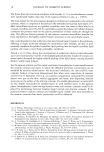
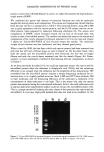
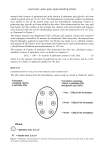
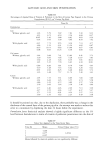
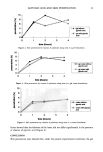
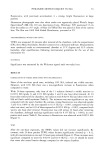
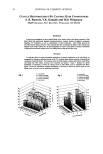
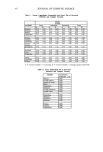
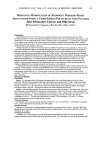
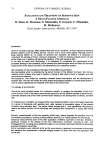
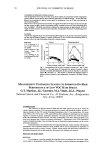
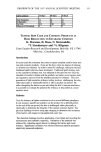
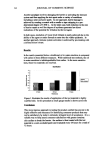
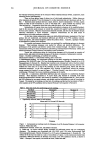
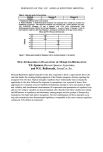
62 JOURNAL OF COSMETIC SCIENCE the elastic forces, i.e. the ratio G"/G', also known as tan delta, is less than 1. The temperature at which tan delta climbs above 1 is the temperature at which phase separation will inevitably occur with time. •n 3 un•tible emul.ion ß ß 1,5 I ß ß ß ß S'•lble ern•,.sl•n I I"l e I1• I" e II ß 0,$ ß eoeooooooo ß ß 0 ß ' ß ß - O 10 20 30 40 • T.mpemtum [ 'C ] O/W-Emulsion K• •T- AK •c..•u'cra• sys•.m to dc•'mmg c,m•b•uY•/ ia m•-m-• Conductivi _ty Methods ff phase separation is occurring in an emulsion, differences in conductivity between the bottom and the top of the body of the emulsion will be detectable considerably in advance of any visual signs of phase separation. This method is applicable to both oil-in-water and water-in-oil systems. Experiments The above principles have been exhaustively tested on a large number of systems. However, we show some exemplary data below to illustrate the principles in operation. An oil-in-water formulation was stabilized by gradually increasing the concentration of a carbomer in the aqueous phase. For each sample, stability was assessed by: • observation of phase separation after storage for 6 weeks at temperature measurement of tan delta between 0 and 60øC 4 hours after emulsion preparation ß observation of the difference in conductivity between top and bottom of the emulsion while cycling between 0 and 60øC over a 24 hour period starting 24 hours after emulsion preparation. INCl Name wløk Olyceryl stearate (and) PEG-100 stearate 2.0• Caprylic/capric triglyceride 8.0• Mineral oil 4.0• Carbomer 0.05, 0.10, 'i3:2oe Glycerin 5.0( Phenoxyethanol 0.5oe Purified Water q.s. 100.0• 0.05% Carbomer 25 deg C 40 deg C 50 deg C , Water Separation 15% vol 40% vol 60% vol Oil Separation no no no ]'an Delta 11.5 2.9 3.2 Difference in Conductivity 0.6 0.6 0.63 0.10% Carbomer 25 deg C 40 deg C 50 deg C Water Separation no no 4% vol [::)il Separation no no no Tan Delta 0.35 0.58 2.2 Difference in Conductivity 0 0 0.26
Purchased for the exclusive use of nofirst nolast (unknown)
From: SCC Media Library & Resource Center (library.scconline.org)