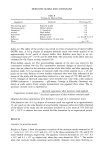
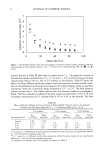
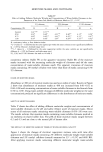
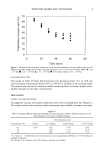
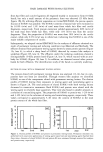
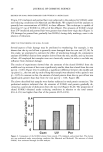
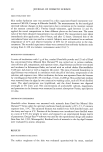
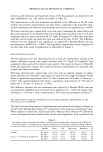
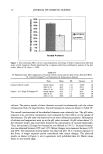
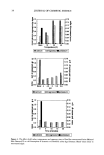
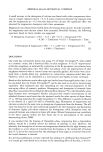
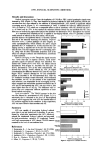
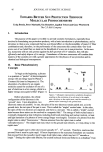
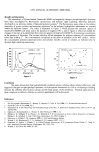
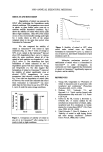
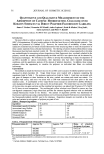
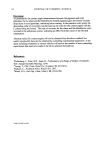
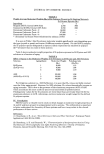
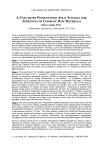
MINERAL-ALGAL-BOTANICAL COMPLEX 31 deviation, and minimum and maximum values of the Rz parameter, as observed in the laser profilometric test. The results are shown in Table II. The improvement in the skin roughness was defined as the difference in the Rz value between two periodic measurements over four weeks, compared to the initial Rz value. In both treatments, the observed improvements were found to be significant (p 0.001). Wilcoxon matched pairs, signed rank, tests were used, comparing Rz values before and after each treatment. It was observed that the mean Rz value was reduced by 43.2% after treatment with the cream enriched with 5 % Triple D Complex TM, while after treatment with the control cream, the mean Rz value was reduced by only 24.9%. The difference between the two treatments was significant, as analyzed by Kruskal-Wallis one-way non-parametric ANOVA (p 0.001). This significant improvement in the roughness of the skin after four weeks of applications is illustrated in Figure 1. SKIN HYDRATION ANALYSIS The SC hydration state was determined by the results of corneometeric analysis of 20 female volunteers treated with cream enriched with 5% Triple D Complex TM and compared to the results of the vehicle cream control. The results are shown in Table III. Small non-significant changes were observed between measurements of untreated skin control areas (data not shown). Wilcoxon matched pairs, signed rank, tests were used to examine changes in values, before and after each treatment. Application of cream with 5 % Triple D Complex TM had shown a significant improvement of 10.5% after 8 hours and 6.4% after 12 hours (p 0.001). The control treatment had shown a significant improvement of 7.9% after 8 hours and 5.1% after 12 hours (p 0.001). The difference between the two treatments was analyzed by Kruskal-Wallis one-way non-parametric ANOVA and was found to be significant (p 0.001 for 8-hour mea- surement, p 0.05 for 12-hour measurement). The results are presented in Figure 2. THE INFLUENCE OF VARIOUS PARAMETERS ON THE PASSIVE MINERAL BIOSORPTION TO THE DUNALIELLA SALINA BIOMASS The ratio of mineral biosorption to algal biomass was evaluated according to changes in the pH of the Mineral Skin Osmoter TM, temperature of the solution, and exposure time. When exposed to Dead Sea concentrated brine (Mineral Skin OsmoterTM), Dunaliella sali,a dry biomass became enriched with calcium and magnesium, with a preference for Table II Rz Values of Skin Treatments With Basic Cream (control) and the Same Cream Enriched With 5 % Triple D Complex TM, as Observed by Computer-Aided Laser Profilometric Analysis, Lasting 4 Weeks Variable Mean SD Minimum Maximum N Control Rz before 235.22 57.10 166.20 393.10 20 Rz after 175.81 40.65 122.70 278.00 20 Cream + 5% Triple D Complex TM Rz before 231.53 43.12 137.60 339.20 20 Rz after 131.18 25.14 75.90 174.10 20

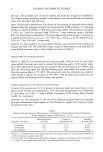
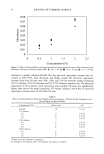
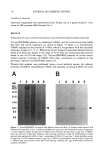
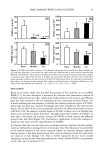
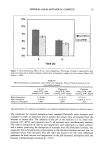
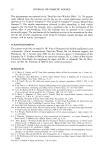
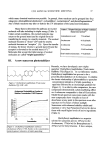
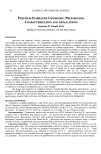
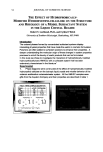
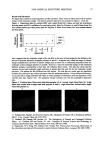
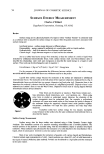
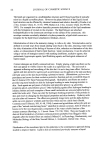
32 JOURNAL OF COSMETIC SCIENCE ,• 50% ß 45% E ß 40% o ß - 35% E 3O% m 25% r- 20% m 15% o 10% r- 5% u) 0% Tested Product •complex [] co ntro I Figure 1. Skin-smoothing effects of two cream preparations: percentage of relative improvement after four weeks of skin treatment. Results determined by a computer-aided laser profilometric analysis of the skin surface. Mean of 20 subjects + SEM. Table III SC Hydration State After Application of Control (vehicle cream) and the Same Cream Enriched With 5% Triple D Complex TM, as Determined by Corneometer Analysis Time Mean SD Variance N Control (vehicle cream) Cream + 5% Triple D Complex TM Initial values 81.8 5.47 28.09 20 After 8 hr 88.2 5.42 28.53 20 After 12 hr 85.9 5.52 31.44 20 Initial values 83.4 5.3 26.4 20 After 8 hr 92.1 5.2 25.59 20 After 12 hr 88.6 4.8 21.84 20 calcium. The passive uptake of these elements occurred simultaneously with the release of potassium from the algal biomass. Typical biosorption values are shown in Table IV. The overall concentrations of the adsorbed elements were relatively low. The pH value, exposure time, and brine temperature were evaluated for their effects on the uptake of the elements. The pH value was found to be the most influential parameter. Biosorption of calcium and magnesium went up as the pH value increased. At pH values above 5.5, the obtained results may have been distorted by precipitation of mineral hydroxides. Thus, the optimal pH range for biosorption was defined as 5.0-5.5. Increased biosorp- tion was obtained between 10øC and 33øC. Minor changes were measured between 33øC and 40øC. The maximum mineral uptake was observed after 10-15 minutes exposure to the brine. A longer exposure period contributed only minor changes. The observed results, as shown in Figure 3, are in agreement with published data (6). Blank values relate to non-treated algae.
Purchased for the exclusive use of nofirst nolast (unknown)
From: SCC Media Library & Resource Center (library.scconline.org)