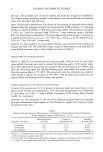
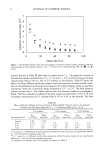
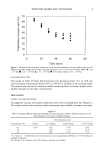
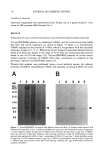
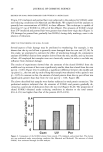
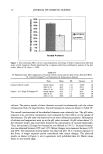
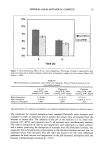
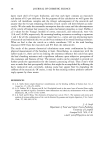
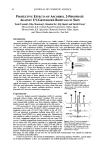
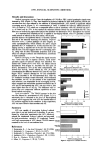
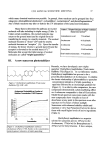
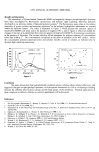
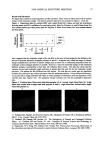
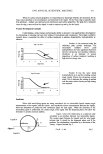
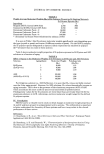
MOISTURE MASKS AND CHITOSANS 5 Table II Formula for Moisture Mask Ingredients Chemicals Percentage (%) Film-forming agent Polyvinyl alcohol 15.0 Thickening agent Methyl cellulose 2.0 Humectant 1-3 butadiene 5.0 Alcohol Ethyl alcohol 12.0 Preservative Methylparaben 0.4 Buffer Sodium citrate q.s. for pH 6.2-6.4 Surfactant Polyoxyethylene 20 oleyl ether 0.5 Water q.s. 100 Saj•ty test. The safety of the product was tested in terms of sensitivity of shaved rabbit (NZW) skin. A 0.1-g aliquot of prepared moisture mask was evenly applied to an approximately 9-cm 2 patch of shaved rabbit skin. Rabbits were kept in an air- conditioned room (25 ø + 0.5øC and 50-60% RH). The sensitivity of the rabbit skin was evaluated by the Draize scoring method (39). Water-holding capacity test. The water-holding capacity of the skin was tested by the corneometer method (40-42). The corneometer measures changes of electrical capaci- tance that are related to the moisture contents of the skin before and after applying the moisture mask. A 0.2-g aliquot of moisture mask was evenly applied to ca. a 25-cm 2 patch on the volar forearm of seven healthy volunteers who were fully informed of the nature of the study and the procedure involved in a test room of 75% RH and 20 ø + 0.5øC. Changes of electrical capacitance were recorded over time with a skin analyzer SHP88 (sebumeter + corneometer + pH-meter, Courage & Khazaka, Germany) ran- domly at eight points. Every sample measurement was repeated three times. The ca- pacitance increase ratio is expressed as: electrical capacitance after moisture mask applied Capacitance increase ratio = electrical capacitance of skin without moisture mask Original electrical capacitances were between 13.4 and 14.2 corneometer units. Film-formation time. A 0.2-g aliquot of moisture mask was applied to an approximately 25-cm 2 patch on the volar forearm of seven healthy volunteers (who were fully informed of the nature of the study and the procedure involved) in a test room of 75% RH and 20 ø + 0.5øC to observe the time needed for film formation by an experienced person. RESULTS VISCOSITY OF MOISTURE MASKS Results in Figure 1 show the apparent viscosities of the moisture masks measured at 10 -1 s to be 5.4x 10³ 4.5 x 10³ , and 4.0x 10 .3 cp for those containing 2% 1% and 0.5% water-soluble chitosans, respectively. The apparent viscosity decreased to 1.8 x 10³, 0.5 x 10³, and 0.1 x 10³ cp, respectively, when they were sheared at 100 s-•. The results show that moisture masks containing water-soluble chitosans were shear-thinning so-

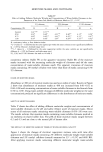
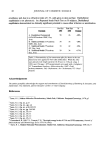
6 JOURNAL OF COSMETIC SCIENCE 7 c•l 0 ! ! 0 3O 60 90 120 Shear rate (l/s) Figure 1. Relationship between shear rate and apparent viscosity of moisture masks containing different concentrations of water-soluble chitosans (1.62 x 10⁶ Da) at 25øC (Concentrations: •, 2% I, 1% ', 0.5%). lutions. Results in Table III show that at a shear rate of 7 s-1, the apparent viscosity of the moisture masks increased from 4.3 x 10³ cp to 6.1 x 10³ cp with increasing chitosan concentration from 0.5% to 1.0% of U3 chitosan in the formula. Table IV shows the effect of adding different molecular weights and concentrations of water-soluble chito- sans on the parameters of the power law equation of the flow behavior index (n) and flow consistency index (k) of moisture masks measured at 23 ø _+ 0.2øC. The flow behavior indexes are less than 1. The results indicate that the moisture masks are pseudoplastic fluids. The flow consistency indexes of moisture masks increased from 4.32 to 6.78 with increasing concentration of U3 chitosan from 0.5% to 1.0% in the formula. The flow Table III Effect of Molecular Weight and Concentration of Water-Soluble Chitosans Used on the Apparent Viscosity and Shear Stress (shear rate of 7 s -•) of Moisture Masks at 23 ø + 0.2øC U3 chitosan U30 chitosan U120 chitosan 'r[ap Shear 'r[a3P p Shear 'r[a2p p Shear Concentration (%) (x 10•Pcps) stress (Pa) (x 10 cps) stress (Pa) (x 10=cps) stress (Pa) Control 2.3 g* 1.97** 0.50 4.3 c'a'e 3.14'5 3.9 e 2.85 3.3 f 2 .46 0.75 4.7 c'a 3.92 4.5 a'• 3.63 4.2 c'a'• 3.43 1.00 6.1 a 4.9 • 5.4 b 4.12 4.8 b'• 3.82'3 * a-g values (n = 3) followed by the same superscript within the same column are not significantly different (p 0.05 by Duncan's multiple-range test). ** 1-7 values (n = 3) followed by the same superscript within the same column are not significantly different (p 0.05 by Duncan's multiple-range test). U3 chitosan, U30 chitosan, and U120 chitosan: the same as in Table I.
Purchased for the exclusive use of nofirst nolast (unknown)
From: SCC Media Library & Resource Center (library.scconline.org)