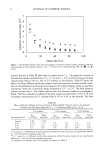
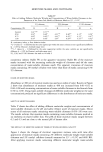
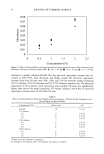
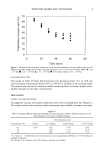
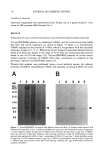
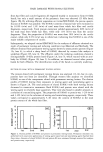
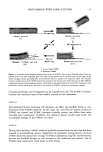
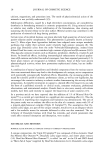
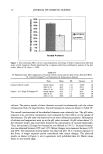
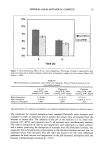
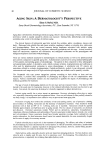
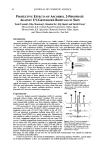
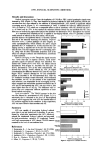
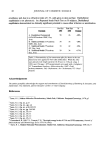
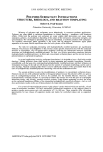
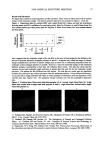
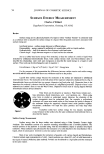
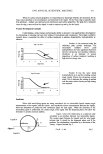
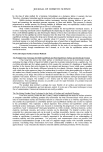
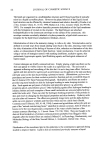
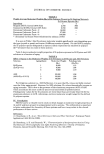
1999 ANNUAL SCIENTIFIC MEETING 57 Results and Discussion We began these studies by examining three cat-HEC polymers which varied in either their level of cationic charge or their molecular weight. The data for polymer deposition are presented in Figure I. From the Figure 1. Deposition data for cationic HEC onto virgin blond hair tresses, one and ten treatments showing mean and 95% confidence for each data point. Data for Polymers A and B taken from five tress measurements per data point, data for Polymer C taken from twenty five tress measurements per data point. ,. 600 -- oo[ L l E E 400 ß E • 300 •" 200 i õ z E• -10 I i '• -200 Cationic HEC 2Std (+) 2Std (-) Mean data it appears that the molecular weight of the cat-HEC is the most critical parameter that influences the amount of polymer deposition (compare polymers A and C). It appears that, within the range of cationic charge examined here, the level of cationic charge plays a minor role in influencing deposition from this surfactant system (compare polymers A and B). However, it must be noted that changes in the surfactant platform, polymer concentration or hair type will influence these results. The data also shows that the variance for the high molecular weight polymers is greater than that seen for the low molecular weight polymers. The reasons for this difference are still unclear. We note that our results gave no significant evidence for build-up for any of these polymers from this surfactant platform. Using confocal microscopy, we are also able to image individual hair fibers to obtain qualitative information about the deposition of the cat-HEC onto hair, Figure 2 [3]. The qualitative images correlate well with the quantitative deposition data. Figure 2. Confocal laser fluorescent photomicrographs of: a) normal virgin blond hair, b) virgin blond hair treated with a single wash with polymer A and c) virgin blond hair treated with a single wash with polymer C. a b c T90-3• / 05:27.9a / 20x / 70 T90-3A / 06:04:98 / 20x 40 T90-3C / 05:27.98 / 10x / 30 l) Goddard, ED Faucher, JA Scott, R J Turney, ME. Adsorption of Polymer JR on Keratinous Surfaces, Part II. J. Soc. Cosmet. Chem., 26, 539 (1975). 2) Goddard, ED Harman, RB Faucher, JA. The Adsorptivity of Charged and Uncharged Cellulose Ethers. In: Goddard, ED and Gruber, JV., eds. Principles of Polymer Science and Technology in Cosmetics and Personal Care. Marcel Dekker, New York, 509-523 (1999). 3) Regismond, STA Heng, YM Goddard, ED Winnik, FM. Fluorescence Microscopy Observation of the Adsorption onto Hair ofa Fluorescently Labeled Cationic Cellulose Ether, Langmuir 55, 3007 (1999).

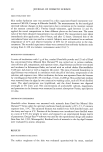
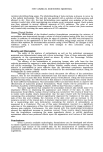
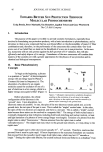
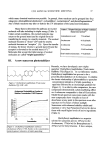
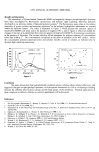
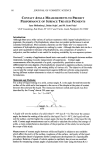
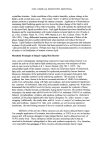
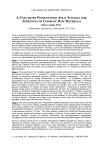
58 JOURNAL OF COSMETIC SCIENCE SURFACE ENERGY MEASUREMENT Charles J. Willard Engelhard Corporation, Ossining, NY 10562 Review Surface energy (c 0 is a physical property of a liquid or solid. "Surface Tension" is commonly used as a substitute term to describe the surface energy of a liquid. Other frequently used terms associated with surface energy are: Interfacial tension - surface energy between to different phases. Dispensability - energy required to uniformly mix a particulate solid in a liquid medium. Hydrophobicity- lack of an attractive force between a solid and water. Contact Angle - Angle between tangents to a liquid surface the substrate Just as a rubber band stores energy when stretched, so does the surface of a solid or liquid when stretched by unbalanced intermolecular forces. Early surface tension work used force/distance units to describe this relationship. Later work uses energy/area to describe the stored energy in a liquid or solid surface. These units can be interchanged as seen in equation 1. Force/distance =( Kg m/s 2 m)* (m/m) = Kg m2/s2m 2 = Energy/area Eq 1 For the purposes of this presentation the differences between surface tension and surface energy are trivial and the reader should feel free to use whichever unit he or she prefers. Liquids have surface energy because the molecules at the surface are subjected to unbalanced intermolecular forces. The molecules in the bulk phase of the liquid are subjected to balanced forces. (fig. l) Intermolecular forces are divided into two groups, dispersive ((•cl) and polar ((•p). Dispersive force is the attraction ofa molecule's electron cloud for the protons of a neighboring molecule. Dispersive force is also referred to as London's force or van der Waal's force. Dispersive forces exist in varying degrees between all molecules and are always attractive. Figure I Polar forces can be attractive or repulsive. Polar forces include acid - base attractions, dipole interactions, acid - acid repulsion, etc.. When using polar force to predict or understand system behavior, the chemistry of the system components must be understood first. For example, a polycationic surfactant will cause most metal oxides to fioc because the positive charges of the surfactant bridge the negatively charged metal oxide particles together. Polyanionic surfactants will repel the same particles and help keep them dispersed. Crystalline solids have surface energy for two reasons: incomplete crystal structure at the surface plus the same unbalanced intermolecular force as described for liquids. Surface Energy Measurement Surface energy data for these studies were obtained using a Cahn Dynamic Contact. Angle Analyzer. This instrument consists of a sensitive recording microbalance and a movable platform. The vertical position of the platform is recorded along with the microbalance output to produce force/depth isotherms. These isotherms typically describe the interaction of a solid attached to the microbalance with a liquid, which is raised and/or lowered to come into contact with the solid. Most of our work investigates the interaction of powders with various liquids and formulations. Classical contact angle measurements of solid - liquid junctions use a sheet (0.5 cm 2) of solid immersed in the liquid of interest (Wilhelmy plate method). Powders can be adhered to a rigid plate and then measured in the same manner.
Purchased for the exclusive use of nofirst nolast (unknown)
From: SCC Media Library & Resource Center (library.scconline.org)