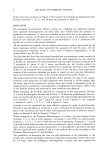
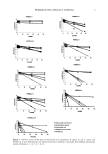
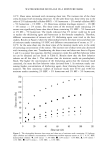
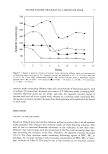
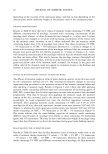
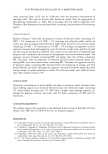
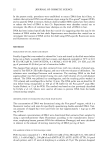
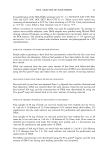
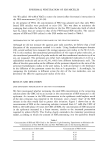
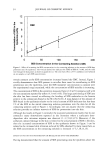
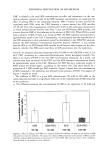
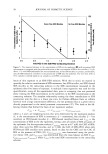
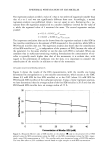
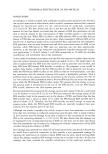
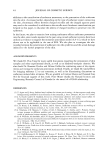
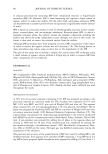
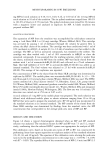
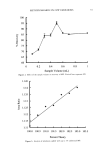
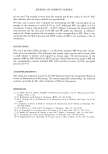
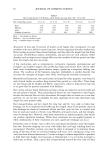
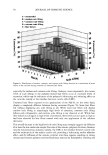
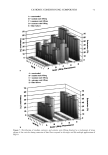
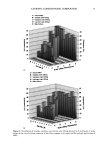
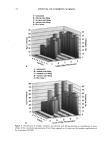
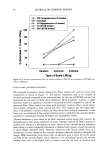
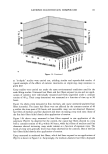
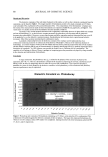
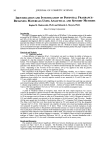
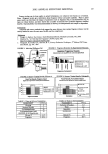
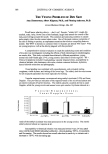
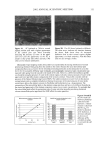
36 JOURNAL OF COSMETIC SCIENCE 100 mM SDS concentrations in the contacting solution is not statistically significant in the presence of PEO, while it is statistically significant in the absence of PEO. According to the monomer penetration model, the reduction in the SDS monomer concentration upon the addition of PEO should lead to a reduction in the amount of SDS penetrating into the epidermis, thus potentially explaining (i). However, the more interesting aspect of Figure 2, (ii), is that SDS bound to PEO contributes very little, if at all, to the amount of SDS measured in the epidermis as the SDS concentration increases from 50 mM to 100 mM, while the SDS in free micelies does. Instead, it is apparent that increasing the SDS concentration in the presence of PEO has no effect on the amount of SDS that penetrates into the epidermis. Therefore, SDS penetration into the skin in the presence of PEO does not increase with total SDS concentration, and follows the prediction of the monomer penetration model. In other words, the addition of PEO modifies the penetration behavior of the miceliar SDS, in effect reducing the system to one that obeys the monomer penetration model. To further study the relationship between the various forms of SDS present in the contacting solution (SDS monomers, free SDS micelies, and PEO-bound SDS micelies) and the SDS concentration measured in the epidermis, the skin was exposed to solutions of 100 mM SDS and different PEO concentrations. The PEO concentration in the contacting solution was varied such that there would be different proportions of free SDS micelies and SDS micelies bound to PEO, thereby controlling the concentration of SDS in free micelies while maintaining a constant total SDS concentration, including SDS monomers, free SDS micelies, and PEO-bound SDS micelies. The effect of increasing the total PEO concentration on the distribution of SDS between free SDS micelies and PEO-bound SDS micelies is shown schematically in Figure 3, with Figure 4 showing how the predicted concentrations of free SDS micelies and PEO-bound SDS micelies vary with increasing PEO concentration at 100 mM SDS (39). Figures 3 and 4 reveal that as the concentration of PEO increases, the concentration of free SDS micelies decreases as more SDS forms PEO-bound SDS micelies. However, as long as free SDS micelies are able to form, the SDS monomer concentration is predicted to remain constant with increasing PEO concentration. This is because once PEO is saturated with SDS micelies, the SDS monomer concentration should increase until the CMC is reached, beyond which free SDS micelies will form (39). However, above a concentration of 1.75 wt% PEO, no free SDS micelies are present, and the SDS monomer concentration is equal to the CAC of SDS in the presence of PEO, -5 mM (39). This was, in fact, the condition under which the measurements reported in Figure 2 were actually carried out. Figure 5 clearly shows that the concentration of SDS in the epidermis decreases as the concentration of PEO in the contacting solution increases, even though the total con- centration of SDS is fixed at 100 mM. Figure 5 also compares this experimentally observed decrease with the ]9redicted decrease in the concentration of SDS in free micelies with increasing PEO concentration, also shown in Figure 4 (39). The observed corre- lation between the concentration of free SDS micelies and the concentration of SDS measured in the epidermis is apparent, clearly demonstrating that SDS in the form of free micelies contributes to the penetration of SDS into the epidermis, while SDS in the form of PEO-bound SDS micelies does not. Although PEO prevents the SDS bound to it from penetrating into the epidermis, the SDS monomer can still penetrate into the epidermis, leading to the plateau observed at PEO concentrations above 1.75 wt%.

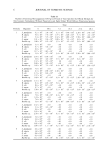
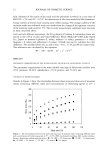
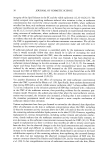
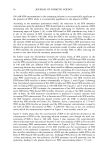
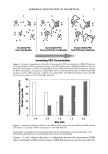
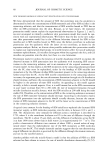
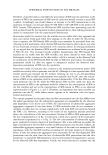
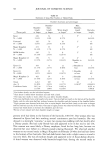
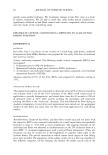
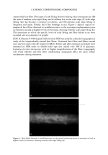
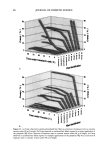
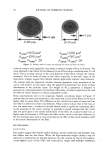
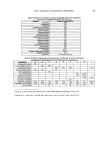
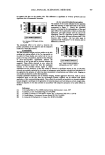
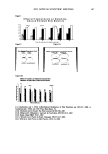
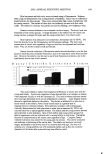
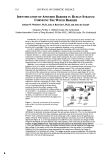
EPIDERMAL PENETRATION OF SDS MICELLES 37 a b No Added PEO Only Free Micelies Some Added PEO Free and PEO-Bound Micelies c Excess Added PEO Only PEO-Bound Micelies Increasing PEO Concentration Figure 3. Schematic representation of the effect of increasing the PEO concentration in a SDS-PEO solution on the distribution of SDS in monomeric form, in free SDS micelies, and in PEO-bound SDS micelies at a fixed SDS concentration. (a) With no added PEO, only free SDS micelies and SDS monomers are present. (b) With intermediate concentrations of added PEO, there are both free SDS micelies and PEO-bound SDS micelies, as well as SDS monomers. (c) With excess added PEO, only PEO-bound SDS micelies and SDS monomers are present, as well as free PEO molecules. lOO 80 20 0.0 0.5 1.0 Wt% PEO 1.5 2.0 Figure 4. Predicted distribution of SDS in free SDS micelies (empty bars) and PEO-bound SDS micelies (solid bars) as a function of PEO concentration at 100 mM SDS (39). REGRESSION ANALYSIS OF THE CONTRIBUTIONS OF SDS MONOMERS, FREE SDS MICELLES, AND PEO-BOUND SDS MICELLES TO SDS PENETRATION INTO THE EPIDERMIS Figures 1, 2, and 5 indicate that there is a relationship between the concentration of SDS that is not bound to PEO and the amount of SDS that penetrates into the skin after five
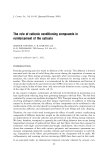
Purchased for the exclusive use of nofirst nolast (unknown)
From: SCC Media Library & Resource Center (library.scconline.org)