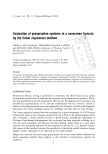
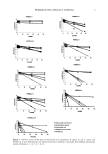
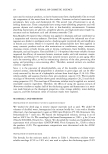
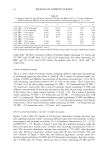
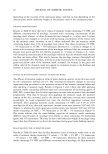
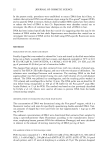
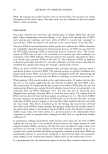
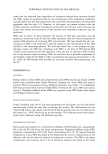
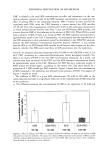
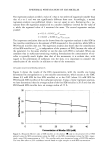
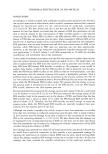
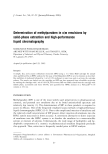
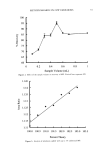
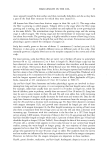
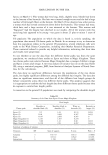
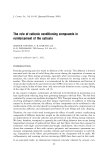
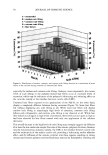
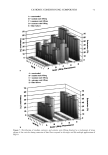
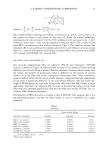
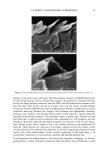
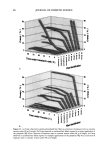
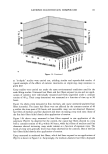
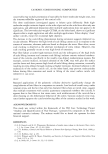
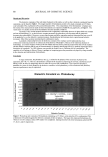
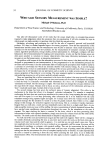
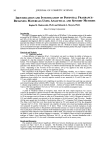
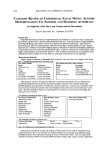
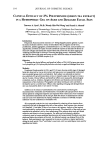
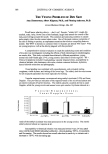
38 JOURNAL OF COSMETIC SCIENCE 7 100 I I I •e 5 Some Free SDS Micelies i No Free SDS Miceli u•4 , • 2 ', 0.0 0.5 1.0 1.5 2.0 2.5 wt% PEO in the •D•-PEO Conicting •olution hours of skin exposure to an SDS+PEO solution. With this in mind, we wanted to quantify the relative contributions of SDS monomers, free SDS micelies, and PEO-bound SDS micelles in the contacting solution to the SDS concentration measured in the epidermis after five hours of exposure. A multiple linear regression was used for this quantification, using all the experimental data, prior to averaging, that was presented above relating the SDS concentration in the epidermis to the SDS concentration in the contacting solution. The simplest relationship among the three contributions to SDS penetration into the skin is a linear one since for Fickian diffusion from an infinite reservoir with a large concentration difference, the net permeant flux at a given time is directly proportional to the initial permeant concentration (47). This leads to the fol- lowing relation that formed the basis of our regression analysis: = a' C ............. + b'C& .... + ...... (3) where a, b, and c are weighting factors that were determined by the regression analysis (C• is the concentration of SDS in monomeric [i = monomers], free micellar [i = free micelies], or PEO-bound micellar [i = PEO-bound micelies] form) and Cj•i, , is the concentration of SDS in the dry epidermis, having units of mmols of SDS per gram of dry epidermis. For the regression analysis, C .............. was set to 8.7 mM, the CMC of SDS, when there were free SDS micelies, and to 5 mM, the CAC of SDS+PEO, when only PEO-bound SDS micelies were present, based on data for the CMC and the CAC of SDS in the presence of PEO (39). Cv•o_3o,,,•,,,i•.ezz• •. was determined using the predic- tive theory (39), and C/ ...... it,/& was determined from the mass balance on SDS (CsD S- Cv•O-3o,,,,,z,,i,-,/&-C ........... ), where Cso s is the total SDS concentration in the contacting solution.

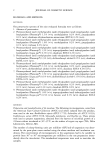
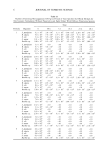
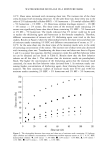
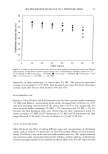
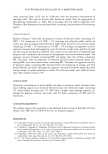
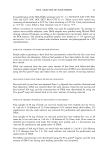
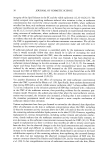
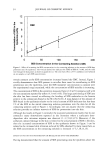
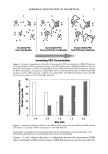
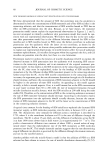
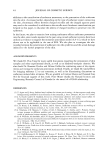
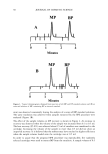
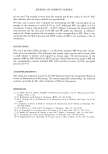
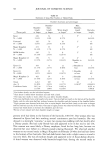
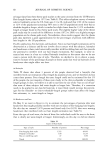
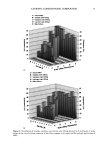
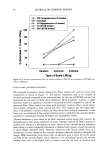
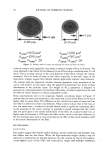
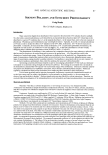
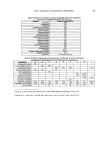
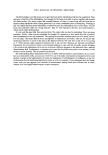
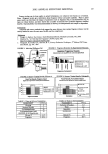
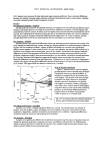
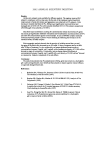
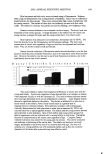
EPIDERMAL PENETRATION OF SDS MICELLES 39 The regression analysis yielded a value of c that is two orders of magnitude smaller than that of a or b, and was not significantly different from zero. Accordingly, a second regression analysis was performed where c was set equal to zero. Removing the c pa- rameter from the regression analysis led to a smaller confidence interval for the value of a, while the regressed value of b remained the same. The second regression analysis yielded: a = 0.14 + 0.04 C,•,/C ........ b = 0.043 + 0.006 Cskir•/Cj•e e mic'eZZes The important conclusion that can be drawn from the regression analysis is that SDS in free micelies contributes to the amount of SDS measured in the epidermis, while SDS in PEO-bound micelies does not. The regression analysis also shows that the contribution of free SDS micelies to C,•i, is independent of the presence of PEO, because the value of the parameter b is the same whether or not the data with PEO is included. When one considers that in surfactant-containing washing formulations the concentration of mi- celies is typically much higher than that of the monomers, it is evident that, with regard to the penetration of surfactant into the skin, it is important to consider the contribution of the micelies in addition to that of the monomers. DYNAMIC LIGHT-SCATTERING RESULTS Figure 6 shows the results of the DLS measurements, with the micelie size being determined by extrapolation to a zero micelie concentration, which occurs at the CMC (about 0.9 mM SDS for free SDS micelies) or at the CAC (about 0.6 mM SDS for PEO-bound SDS micelies) of the surfactant solution. Using a linear regression analysis, we have determined that the average radius of the free SDS micelies is 20/t and that the PEO-bound SDS micelies have an average radius of 25 •. 30 e 25 o 20 15 0 10 20 30 40 Concentration of Miceliar SDS (mM) Figure 6. Measured effective radii of SDS micelies in the absence (O) and in the presence ([•) of PEO plotted versus the SDS concentration minus the CMC, or the SDS concentration minus the CAC, respec- tively, using DLS measurements at 25øC. The miceliar radii were determined using a CONTIN analysis. The error bars reflect a 95% confidence interval based on eight samples at each SDS concentration.
Purchased for the exclusive use of nofirst nolast (unknown)
From: SCC Media Library & Resource Center (library.scconline.org)