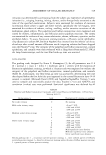
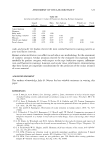
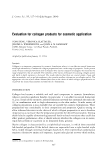
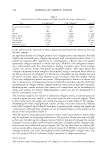
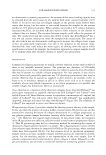
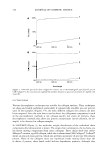
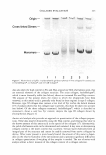
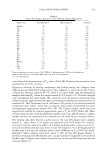
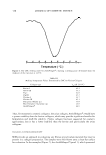
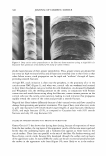
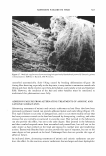
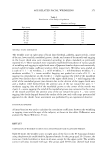
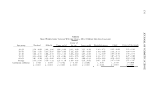
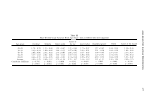
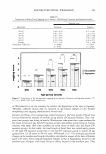
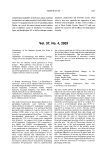
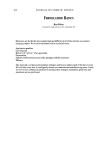
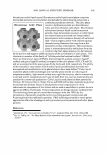
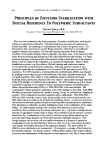
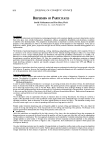
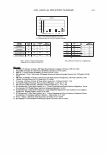
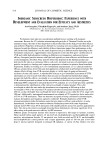
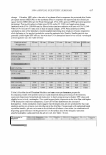
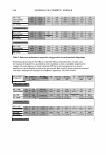
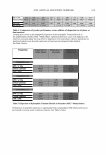
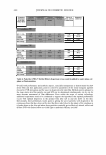
COLLAGEN EVALUATION Table II Amino Acid Analysis Results for Three Different Collagen Preparations Amino acid AteloHelogen® CLR Collagen® Collasol® HOPro 98 73 Asp 42 48 Thr 17 19 Ser 22 31 Glu 73 80 Pro 125 121 Gly 347 325 Ala 114 112 Cys n.d. n.d. Val 19 25 Met n.d. n.d. Ile 11 14 Leu 24 31 Tyr 1 7 Phe 13 16 His 4 6 HOLys n.d. n.d. Lys 28 31 Arg 54 55 Trp n.d. n.d. Data are expressed as residues per 1000. HOPro: 4-hydroxyproline. HOLys: hydroxylysine. Amino acids sensitive to oxidation (Met and Cys) were not determined. n.d.: not determined. 83 44 17 28 80 123 342 113 n.d. 26 n.d. 13 29 3 14 4 n.d. 26 50 n.d. 337 tions allowed the determination of Tm values (Table III). Replicate determinations were reproducible to 0.3°C or better. Significant variation in melting temperature was evident among the collagens from different species (Table III). Comparison of type I collagen Tm values shows that chicken collagen was the most stable at 44.7 ° C, about 2.5 ° C more stable than the mammalian samples, which had Tm values in a range between 42.0°C and 42.2°C. The fish collagens were considerably less stable (Table III), consistent with the previous observation that collagen stability approximates the upper environmental temperature experienced by an organism (8). Thus Macruronus lives in cold waters (29), giving it a lower environmental temperature than Tilapia, which lives in tropical regions where farmed fish may have environmental temperatures around 30°C (30). The Tilapia collagen, which has been suggested as suitable for cosmetic applications, gave a Tm of 35 .8°C (Table III). There is some variation of Tm with the pH of the samples, and so the pH of cosmetic collagen samples needs to be considered if the solutions are not made up in a standard solvent. The melting data show that for a given species, the type III collagen had a slightly greater Tm value, about l.2°C higher for mammals and 0.4°C higher for chickens, consistent with the stabilizing effects of a higher hydroxyproline content and the C terminal disulfide bonds that are present in type III collagen (1 7 ,31). Although purified chicken type I and type III collagens show a small difference in Tm (Table III), Atelo Helogen®, which contains a low level, about 7-10% of type III collagen (Figure 3, personal communication, Meddicoll), gave a single transition comparable to the purified chicken type I collagen, and a higher transition due to the type III component was not observed (Figure 6).

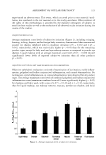
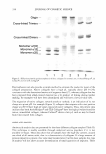
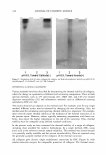
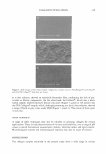
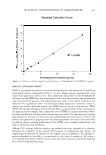
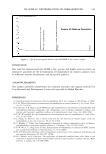
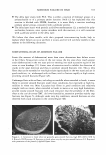
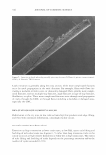
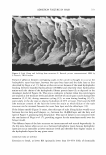
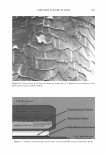
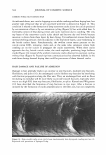
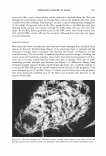
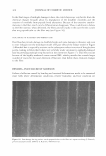
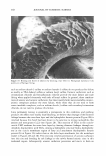
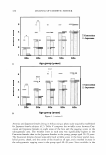
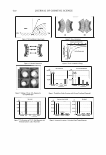
338 .. I JOURNAL OF COSMETIC SCIENCE a I " I ti I G 1 I Temperature ( °C) .. " I • I 1 I ' ' Figure 6. The DSC melting curve for AteloHelogen®, showing a melting point determined from the midpoint of the transition at 44.6°C. Table III Melting Temperature Values Determined by DSC for Various Collagens Collagen type Bovine I Bovine III Pig I Pig III Chicken I Chicken III Nile perch (Tilapia sp.) Blue Grenadier (Macruronus sp.) AteloHelogen® Tm pH 2.8 (°C) 42.2 43.5 42.0 43.2 44.7 45.1 35.8 23.0 44.6 Thus, for monomeric cosmetic collagens, the avian collagen, AteloHelogen®, would have a greater stability than the bovine collagens, which may provide significant benefits for formulation and shelf-life stability. Tilapia collagen has been suggested for cosmetic applications, but it has a lower stability than the bovine and particularly the avian collagens. SCANNING ELECTRON MICROSCOPY SEM provides an approach to evaluating any fibrous or particulate material that may be present in a collagen preparation. The samples were dried down onto a clean flat surface for evaluation. In the examples (Figure 7), the AteloHelogen® (panel 1), which presented
Purchased for the exclusive use of nofirst nolast (unknown)
From: SCC Media Library & Resource Center (library.scconline.org)