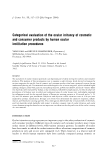
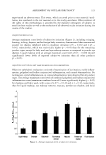
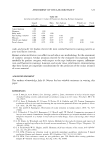
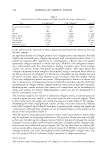
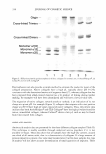
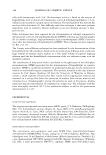
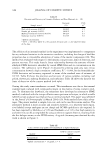
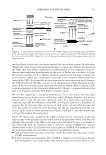
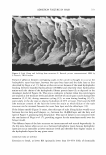
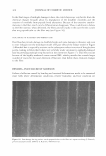
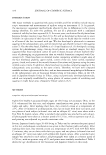
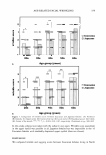
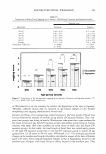
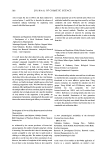
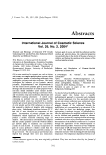
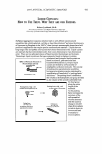
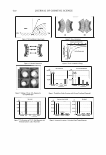
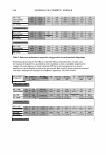
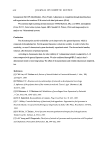
COLLAGEN EVALUATION 335 Origin- Cross-linked Dimers - Monomers- 1 1 2 2 3 3 Figure 4. Native (lactic acid pH 3.1) polyacrylamide gel electrophoresis of three collagens for cosmetic use: (1) AteloHelogen®, (2) Collasol®, and (3) CLR Collagen®. data also show the high content in Pro and Hyp, around one fifth of all amino acids, that are essential elements of the collagen structure. The avian collagen, AteloHelogen®, which is more thermally stable (see below), shows an increased Pro and Hyp content. The amount of Tyr present shows the extent to which the telopeptides have been removed, as this amino acid is generally only found in these regions in type I collagen. However, type III collagen does contain a low level of Tyr within the helical domain (17) if analysis shows that this collagen type is present, this must be taken into account (see below). Of the three collagens examined, AteloHelogen®, which is described as monomeric, shows a very low Tyr content, despite the type III collagen shown by electrophoresis (Figure 3 ). Amino acid analysis also provides an approach to quantitation of the collagen prepara tions. These data may be obtained by using the H yp content, and relating this value to the known amount of this amino acid in the species of the collagen (17). Alternatively, the yields of all amino acids can be determined and summed. A key issue in determining collagen content is the water content that is present. Certain water molecules form an integral part of the structure and cannot be readily removed from native collagens by drying. Other water present is more loosely bound the amount of this water is depen dent on the relative humidity of the environment and so presents significant difficulties in collagen quantitation if weighing of dry samples is needed. The use of amino acid analysis allows a direct measure of the collagen content of a collagen solution.

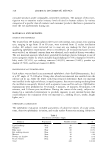
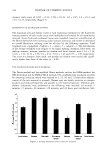
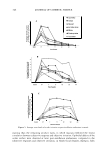
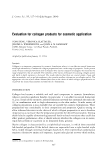
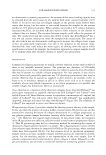
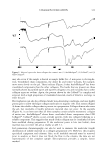
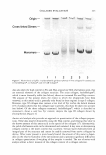
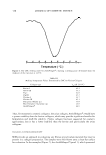
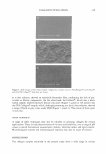
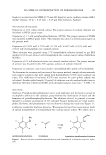
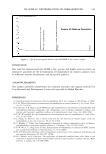
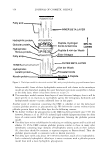
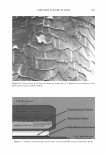
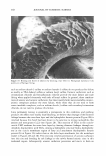
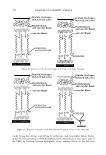
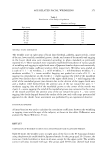
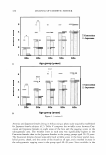
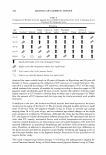
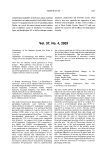
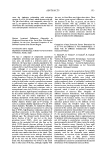
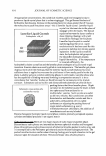
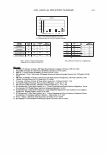
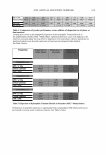
336 JOURNAL OF COSMETIC SCIENCE 1 2 3 pH 8.9, Toward Cathode(-) 1 2 3 pH 8.9, Toward Anode(+) Figure 5. Estimation of pl for three collagens for cosmetic use from electrophoretic mobility at pH 8.9: (1) AteloHelogen®, (2) Collasol®, and (3) CLR Collagen®. DIFFERENTIAL SCANNING CALORIMETRY Various methods have been described for determining the thermal stability of collagens, where the change in a parameter is followed with increasing temperature. These include spectral methods, such as UV spectroscopy (25), ORD (20), and CD (21) enzyme digestion susceptibility (26), and calorimetric methods, such as differential scanning calorimetry (DSC) (27 ,28). The results obtained can depend on the method used. For example, even for any single method, different results may be obtained by changing the rate of heating. Also, the method used for calculating and reporting thermal stability is important. For example, most correctly report thermal stability as the midpoint of the thermal transition, as in the present report. However, others, typically measuring preparations with lower sta bility, may report the higher temperature at the end of the transition. Thus, thermal stability must be compared using defined standard conditions. In the present study we have examined the thermal stability of a range of collagens, including those available for cosmetic formulation, by a single method, DSC, using acetic acid as the solvent to ensure sample solubility. This method was chosen because it is generally readily available and has proven reproducibility. Data are reported using the generally accepted method of the midpoint of the thermal transition. All collagens gave distinct single endothermic transitions by DSC (Figure 6), with similar transition energies for comparable quantities of collagens. The thermal transi-
Purchased for the exclusive use of nofirst nolast (unknown)
From: SCC Media Library & Resource Center (library.scconline.org)