FCP DESCRIPTIVE ANALYSIS OF STICK BASES 457 • PPG-5-ceteth-20: tensoactive, water-soluble, having emollient and moisturizing properties. • PPG-15-stearyl ether: easily spreadable emollient, lubricating skin without excessive oiliness. Propyleneglycol and the conditioning agent were heated in a water bath to 80°C. Sodium stearate was then added, and the solution was stirred until total dispersion was reached. Finally, water heated to 80°C was added, and the formulation was stirred until it was homogeneous and then molded at 60°C (17 ,18). The Ethics Committee of the Universidad de la Republica Oriental del Uruguay con cluded that all samples were adequate for testing on humans. SENSORY ANALYSIS�FREE-CHOICE PROFILE (FCP) Selection �f descriptors. A panel of eight assessors from the Faculty of Chemistry trained in the descriptive analysis of food products, but with no previous experience in evaluating cosmetics, participated. Vocabulary development consisted in presenting to assessors two pairs of samples in three sessions. Each pair had the lowest (2%) and the highest (6%) concentration of two different conditioning agents (see Table I): Session 1: Al-B3 and Cl-A3 Session 2: Bl-A3 and Cl-B3 Session 3: Al-C3 and Bl-C3 Assessors were asked to describe differences perceived between the samples of each pair in: • Sample surface by observing the lateral surface of the stick portion extracted. • Sensations experienced when the stick was applied twice on their inner forearm. • Sensations perceived on skin when touching with the fingers, right after the stick was applied. • Skin characteristics five minutes after application, by touching with the fingers. Later on, individual interviews were held, in which assessors selected the terms they wished to use for evaluation in their individual score sheets. A training session was carried out afterwards using these personal score sheets, providing assessors the chance to modify or clarify descriptors. Finally, individual score sheets with non-structured 10-cm scales were obtained to describe attribute intensity. Sample evaluation. A balanced complete block experimental design was carried out for duplicate evaluation of the nine samples during nine sessions (two samples per session). The samples were evaluated at room temperature and labeled with three-digit code numbers. Non-structured 10-cm scales were used to describe attribute intensity. Sensory testing was performed in a sensory laboratory that was designed in accordance with the ISO (1988) standard (19). STATISTICAL ANALYSIS FCP sensory data were analyzed by generalized procrustes analysis (GPA) using Senstools for Windows, version 2.2.21 software (Oliemans, Punter and Partners BV and Talcott BV, Utrecht, The Netherlands). In sensory profiling an assessor scores N samples for V attributes or descriptive terms, providing an N x V matrix. These data may be considered as representing a configuration

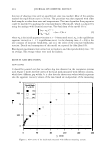
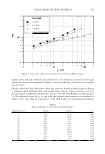
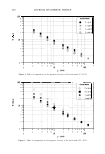
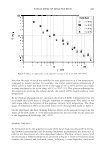
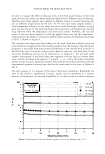
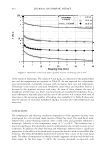
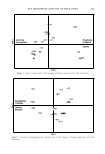
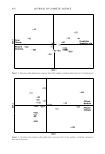
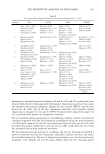
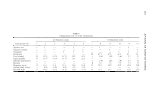
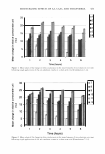
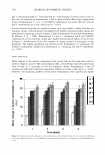
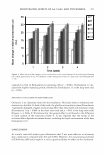
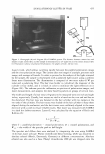
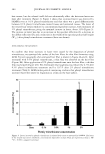
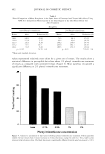
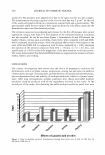
458 JOURNAL OF COSMETIC SCIENCE of N points and V dimensions. Procrustes analysis originated as a method for matching two such configurations when two assessors scored the same set of samples. In practice, M assessors are involved and each produces a configuration. In generalized procrustes analysis (GPA) the configurations are compared simultaneously. These configurations are iteratively matched to a common consensus configuration. This consensus configu ration is the mean of the transformed configurations, and replaces the panel mean of the untransformed configurations. Transformation steps include translation, rotation/ reflection, and scaling (8). In this case, replicate assessment of samples by each assessor was included as data, providing individual matrices with 18 rows (nine samples x two replicates) and V columns (according to the number of descriptors used by each assessor). An average consensus map of the samples was obtained and the three dimensions were interpreted, considering correlation coefficients � I0.5I for each assessor (9). RESULTS AND DISCUSSION Assessors selected a number of descriptors ranging from 11 to 19, grouped into four categories: • Stick aspect (ASP) • Sensations during application (SDUR) • Sensations after application (SAFT) • Sensations five minutes after application (S5MIN) There were many common terms across the group of assessors such as opacity or trans parency in ASP category, spreadability in SDUR, and absorption rate in SAFT, used by all assessors. In order to evaluate an assessor's performance (reproducibility, discriminating ability, and panel agreement), assessors' configurations and residual variances, and sample con figurations for each assessor, were considered. The consensus space showed that the assessors perceived the samples in the same way and had a low residual variance in the first dimension. The total amount of variance explained by the first dimension of the average configu ration consensus map of the samples with their repetitions was 80.9% for ASP, 50.9% for SDUR, 64.3% for SAFT, and 58.8% for S5MIN. The second dimension explained 9.2% of the variation of ASP, 20.2% of SDUR, 12.9% of SAFT, and 13.0% of S5MIN. Sample consensus configurations with their duplicates for all assessors is shown in Figures 1-4 for each category of descriptors. As seen in the figures, the samples were considerably distanced, indicating that they differ markedly in their sensory attributes. In order to define the main attributes that differentiate samples, correlation coefficients between the attributes and the first dimension in the sample space were calculated. Sensory descriptors from each assessor showing high correlation (lrl � 0.5) with the first dimension are given in Table II. For the stick-aspect set, roughness, exudation, and opacity (correlation coefficient greater than 0.88) showed a positive correlation with the first dimension, while uniformity and
Purchased for the exclusive use of nofirst nolast (unknown)
From: SCC Media Library & Resource Center (library.scconline.org)