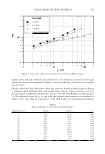
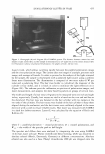
FACIAL MASK OF DEAD SEA MUD 443 salts and sulfide compounds originated from microbiological activity ( 4). The particle size distribution of the mud solids is 86-98% 5 µm 2-9%: 5-20 µm and 0-7% 20 µm. The stabilizer "polysaccharide" is a modified starch containing glucose as the sole monomer with a molecular mass of 5 to 6 million daltons. It is obtained by fermentation of Sclerotium rolfsii on a glucose-enriched medium. The fermentation medium is filtered. After being washed with alcohol, the product is again dissolved, filtered, and dried. The type of linkages found in the molecule gives it a high stability polysaccharide aqueous solutions show therefore a good resistance to aging and most enzymatic degradations. Polysaccharide displayed a good ability to stabilize the mud suspension due to its capacity to increase in a significant and stable way the viscosity of the medium. Poly saccharide can be used in suspensions at a recommended dosage level of 1.0-1.5 wt%. RHEOLOGICAL MEASUREMENTS The rheological properties of facial mud were measured with a concentric-cylinder Haake-VT 500 viscometer, which has an inner cylinder rotating in a stationary outer cylinder. Three different measuring systems were used: MV2, MV3, and SVl. MV2 and MV3 used the same cup, with a radius of 21.0 mm, and different bobs, with radii of 18.4 and 15 .2 mm, respectively. On the other hand, the cup radius of the SVl system is 11.5 5 mm, while its bob radius is 10.1 mm. Samples were allowed to relax (more than 10 min) prior to measurement of their viscosity. It should be pointed out that the viscometer operated in the range where the laminar flow is dominant. The viscometer was ther mostatically controlled with a water circulator (Haake D8) at the desired temperature with a precision of ± 0.1 °C. METHODOLOGY The experiments performed to characterize the shear-, time- and temperature depen dency of the flow behavior of Dead Sea mud consisted of a series of two measurements: Apparent viscosity versus shear rate. A fresh sample was loaded into the annular gap of the concentric -cylinder viscometer. Samples were left to reach the desired temperature. The apparent viscosities of facial mud were measured in the temperature range between 5 .0° and 60.0°C by continuous increasing (forward measurements) and continuous decreasing (backward measurements) of the shear rate. The values of the shear rate and apparent viscosity were recorded every 30 sec. The shear rate was varied from 2.200 to 159.80 s- 1 . The flow curves of the facial mud was modeled using the Herschel-Bulkley (H-B) model: (1) where T is the shear stress, TO is the yield stress, m is the consistency coefficient, and n is the flow behavior index. Typically, the Herschel-Bulkley model is used for many materials, as the Newtonian, shear thinning, shear thickening and Bingham plastic may be considered as special cases. Apparent viscosity measurements as a function of time at constant shear rate. In transient measurements, a fresh sample was sheared at constant shear rates, namely at 2.20, 10.21, 28.38, 47.43, 79.02 and/or 131.90 s-1, and the apparent viscosity was measured as a

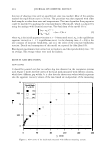
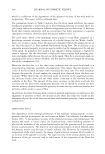
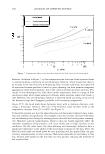
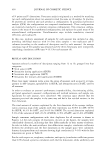
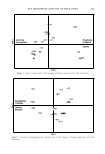
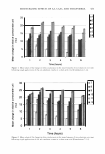
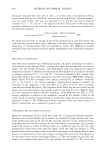
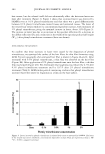
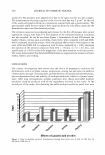
444 JOURNAL OF COSMETIC SCIENCE function of shearing time until an equilibrium state was reached. Most of the samples reached the equilibrium state in 30 min. The procedure was then repeated with other fresh samples at other shear rates and temperatures. The time-dependent flow properties could be modeled by applying the structural kinetic (SK) model, which is adopted by using the analogy with chemical reactions. The final form of the model (9) is: (2) where TJo is the initial apparent viscosity at t = 0 (structured state), T]00 is the equilibrium apparent viscosity as t ➔ 00 (equilibrium state), t is the shearing time, k = k (-y) is the rate constant of structure breakdown, and a is the order of the structure breakdown reaction. Details and assumptions of this model are reported by Abu-J dayil (9). Rheological experiments were carried out in triplicate, and the reproducibility was ± 5 % on average. The average values were used for analysis. RESULTS AND DISCUSSION FLOW CURVES It should be pointed out that no surface slip was observed in the viscometer systems used. Figure 1 shows the flow curves of the facial mask measured with different systems, which have different gap widths. It is clear that the shear stress values (which represent also the apparent viscosity values) of the mud mask are independent of the measuring 250 ----------,---------,--------,------......------ 200 150 100 so 0 Facial Mask T = 25 °C ■ M� / W ::-1- -- -1- �- -1-------1-·- - - ---i-- ___ ,_ - -!-- --+ i ■ V ! ! i • r : : : - ----- . --- ---i-------------- --------i---------------------- -----------------------i----------------------- , I I I : ----------------------:-----------------------:----------------------:-----------------------:----------------------- 40 80 120 y (1/s) 160 200 Figure 1. Flow curves of the facial mask measured with different measuring systems.
Purchased for the exclusive use of nofirst nolast (unknown)
From: SCC Media Library & Resource Center (library.scconline.org)