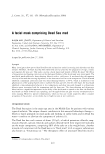
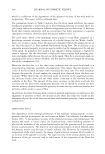
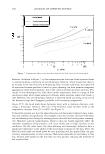
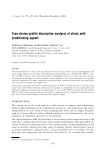
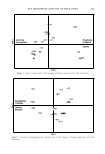
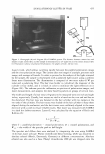
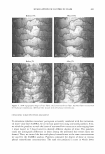
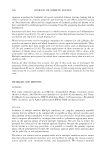
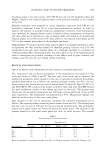
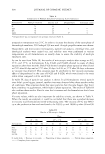
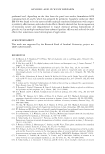
EVALUATION OF LUSTER IN HAIR 481 Before_0.5% After_0.05% Before_2% After_2% Figure 4. AFM topography images of hair fibers. (A,C) Untreated hair fiber. (B) Hair fiber treated with 0.5% phenyl trimethicone. (D) Hair fiber treated with 2% phenyl trirnethicone. CONSUMERS' SUBJECTIVE SHINE ASSESSMENT To determine whether consumers' perception accurately correlated with the instrumen tal luster value from SAMBA, we carried out panel tests using untrained panelists. First, we asked the panelists to rank the luster of untreated hair tresses on a scale ranging from 1 (most luster) to 5 (least luster) to identify different degrees of shine. The panelists could not distinguish differences in shine among the untreated hair tresses (data nor shown). Then, we treated the hair with phenyl trimethicone at the same concentrations we used for the SAMBA analysis. Panelists compared the degree of shine at various phenyl trimethicone concentrations. The rank test produced a score in which lower

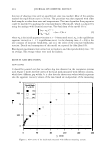
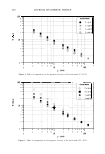
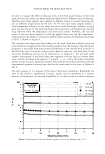
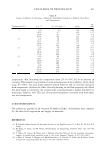
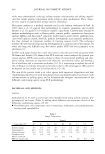
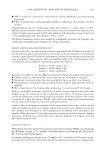
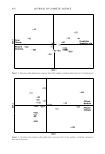
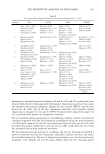
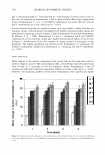
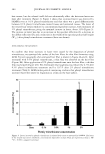
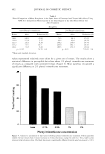
482 JOURNAL OF COSMETIC SCIENCE Table I Paired Comparison of Mean Roughness in the Same Areas of Untreated and Treated Hair Fibers Using AFM: Five Independent Measurements of the Same Region of the Hair Fibers Before and After Treatment Roughness 0.5% Phenyl trimethicone 2% Phenyl trimethicone Before After Reduction (%) 146.1 149.1 -2.06 122.0 115.4 5.37 121.5 116.3 4.28 117.2 97.7 16.7 103.1 93.5 9.26 p = 0.107 *6.70 6.9 * Mean and standard deviation. Before 73.5 96.2 194.2 203.8 189.5 p 0.01 After 64.3 65.6 154.0 182.7 152.3 Reduction (%) 12.63 34.94 20.74 10.35 19.64 *19.65 9.6 values represented relatively more shine for a given set of tresses. The results show a statistical difference in perceptible hair shine above 1 % phenyl trimethicone treatment of tresses as compared with untreated tresses (Figure 5). Most panelists recognized a significant difference at 2% phenyl trimethicone treatment. 60 ..... $--4 40 - 20 base 0.1% 0.5% 1% 2% Phenyl trimethicone concentration Figure 5. Subjective assessment of hair luster following phenyl trimethicone treatment. Fifteen panelists ranked the hair tresses from 1 (most lustrous) to 5 (least lustrous), using the rank test. Thus, lower values represent relatively more shine. The black bar group is significantly different from the gray bar group (p 0.01).
Purchased for the exclusive use of nofirst nolast (unknown)
From: SCC Media Library & Resource Center (library.scconline.org)