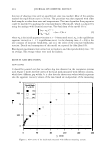
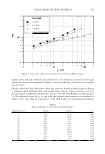
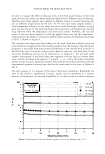
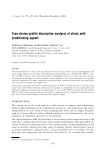
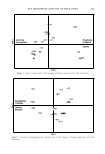
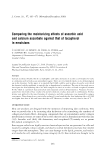
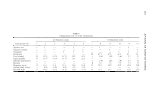
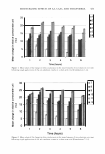
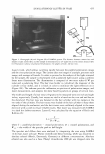
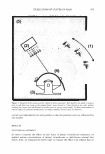
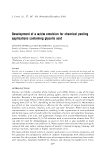
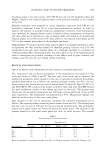
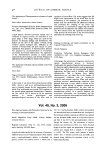
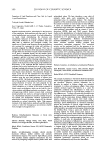
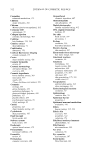
- t. 100 FACIAL MASK OF DEAD SEA MUD 445 4 ,-:::=======�==""':""::-:--�-----:-------:----:----:-�---, 8 6 4 1 Facial T = 5 °C T = 15 °C ' ' ' ---,-----.---------------,-------------- ------- ----- ---- -------------- T = 50 °C ' ' ' ' ' ' ' ' ' ' ' ' ' ' ' ' ' ' ' ' ' Hreschel-Bulkley model / j j I I I I I ---------•- --- -, ••••-•••••••••• r •••-••-• T ·----,---•,------- •••••• •-••••••••••• r-•• •- • ••• -,. ••• • • • • •-••••• I 1 I I I I I I I I I I I I I I I I I I I i I I I I I I --------------,------••--•----,----•••- -- 7---- - --------T·----------•••·I1··------•1••-•- ••••t••••---•------I 1 I I I I I I I I I I I I I I I I t I I I I I I I J I I I I I I I I I ---•·•--------�- ______ ,1. _____ _, ____ 1 ................................... L ................................. 1 ....................... L............ ____ .1 ______________ _ I I I J I I I I I I I I I I I I I I I I I I I I I I I I I I I I I I I I I I I I I I I I I I I 1 J I I I I I I I I I I l I I I I I I I I I I I -------------- -1-------- --- - --- p - - ------'1" ----- -l---- -l--------------- ♦ ------ - -- ------i- --- - - - - -I'----- ----'1" --- ---- ------ -- I I I I I I t I I I I I I I I t I I I I I I I I I I I I I I I I I I I I I I I I I I I I I I I ! I I I I I I I I I I I I I I I I I I I I I I I I I I I I I I I I I I I I I t I I I I I I I I I I I I I I I I I I I I I I I I I I I I I I I I I I I I I I I I I j I I I I I I I I 4 6 8 10 4 y (1/s) 6 8 100 Figure 2. Flow curves of the facial mask fitted to the Herschel-Bulkley model. system. Since the slip conditions encountered in a viscometer are a function of the gap width, the data points presented in Figure 1 show that the slip conditions in our system are not clear. On the other hand, the shear stress-shear rate curves of the facial mask shown in Figure 1 indicate a shear-thinning flow with yield stresses. Figure 2 shows the flow curves of the mud mask at different temperatures, fitted to the Herschel-Bulkley model (equation 1). The regressed values of T 0, m and n for the forward measurements are presented in Table I. It is clear that the parameters of the H-B model are temperature-dependent, Table I Regressed Parameters of the Herschel-Bulkley Model Temperature ( ° C) 'T 0 (Pa) m (Pa sn) n 5 40.0 11.30 0.63 10 38.0 10.43 0.62 15 35.0 9.96 0.62 20 29.5 9.17 0.62 25 30.6 14.66 0.49 30 40.7 21.92 0.38 35 60.0 25.16 0.32 40 70.0 30.34 0.22 45 67.0 29.58 0.18 so 56.1 8.34 0.42 55 54.S 7.20 0.45 60 52.3 5.53 0.45

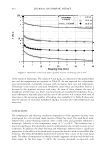
446 JOURNAL OF COSMETIC SCIENCE which is a reflection of the dependence of the apparent viscosity of the mud mask on temperature. This aspect will be addressed later. The parameters shown in Table I indicate that the facial mask exhibited two major rheological properties: a yield stress and a shear-thinning behavior at stresses above the yield stress, where the n-values at different temperatures are less than unity. It has been found that cohesive sediments, such as concentrated clay water suspension or aqueous days/grains mixtures, show the same rheological behavior (10,11). The yield stress, which is the minimum stress required to start flow, ongrnates in a percolating network of strong interactions of colloidal forces (van der Waals, double layer, etc) or direct contact forces (friction and collision) between the small particles of the Dead Sea mud (12). This network was broken during flow. The yield stress is an important material property in various aspects involved in the transport and the end use of the mask. To guarantee that quality is not impaired during transport, a high-yield stress is required. On the other hand, a high-yield stress requires high pumping pres sures and makes difficulties in the end use of the mask. Thus for a given mud mask, an optimum yield stress is always desirable, and this may be achieved simply by adjusting the solids concentration (13). Moreover, the fact that n is less than unity indicates that the mud facial mask is a shear-thinning material, regardless of temperature. This means that the apparent vis cosity of the facial mask decreases with increasing the shear rate. The weak bondings between the particles of mud explain the strength drop observed when the shear rate increases. When these bonds are destroyed under an increase of the tangential stresses, the structure breaks down and the water earlier contained in the network becomes available to the flow. The amount of free water increases in the slurry and both the viscosity and the shear stress temporarily decrease (14). It should be pointed out here that the presence of water between the particles increases the slip conditions between the particles, which results in ease of flow. In addition, the shear thinning often evident in mineral suspensions is attributed to the alignment of particles or floes. An increase in the shear rate from rest results in the alignment of particles in the direction of shear, and therefore provides a lower resistance to flow (15). TEMPERATURE EFFECT The dependence of the rheological behavior of the stabilizer "polysaccharide" on tem perature was first investigated. As can be seen in Figure 3, at relatively low shear rates (below 300 s- 1 ), the apparent viscosity of the stabilizer increases with temperature. On heating the starch in excess water, the branched-chain, water-imbibing polymer of glucose (the monomer of the polysaccharide) melts, and the granules swell in a process known as gelatinization. The degree of structural gelatinization of starch depends upon the heating process and the type of starch utilized (16). However, by increasing the temperature of the starch system, the degree of gelatinization increases, which results in an increase in the apparent viscosity. The high viscosity of the polysaccharide and the formation of the gel structure lead to stabilization of the suspension of the Dead Sea mud.
Purchased for the exclusive use of nofirst nolast (unknown)
From: SCC Media Library & Resource Center (library.scconline.org)