HPLC DETERMINATION OF ARBUTIN 39
Mobile phase flow rate. The optimum flow rate of the mobile phase should provide good
separation, high sensitivity, and short analysis time. In this work, after the optimal
wavelength was selected, optimization of the flow rate was carried out by injecting the
same concentration of mixed standard solutions at varying flow rates from 0. 5 ml/min -l
to 1.0 ml/min- 1
.
Recommended RP-HPLC procedure. A sample and/or standard solution containing arbutin
was separated on a reverse-phase ODS Hypersil® C
18
column (125 mm x 4 mm, 5.0 µm)
and detected at 222 nm. An aliquot of 100 µl of a series of arbutin standard solutions
and 100 µl of sample extract was injected into the LC system and eluted with the mobile
phase, water:methanol:0.1 M hydrochloric acid (89: 10: 1, v/v/v) (flow rate =1.0 ml/
min- 1 ).The area of the arbutin peak was measured. Arbutin concentration in the plant
extract was determined by reference to the calibration curve prepared under identical
experimental conditions.
RESULTS AND DISCUSSION
A high-performance liquid chromatographic method for the determination of arbutin in
skin-whitening creams and medicinal plant extracts containing arbutin was developed.
The experimental conditions were investigated and the proposed method was also vali-
dated.
OPTIMIZATION OF RP-HPLC CONDITIONS
The optimal conditions of HPLC for determining arbutin were carried out under iso-
cratic conditions. Various mobile phase systems with different compositions were in-
vestigated. First, the optimal wavelength for the detection of arbutin and other com-
pounds, as mentioned earlier, was investigated, and the UV spectrum of each standard
compound showed the absorption maxima at 222 nm. A wavelength of 222 nm showed
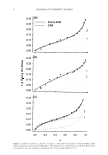
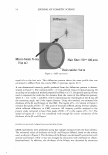
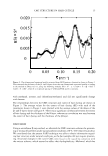
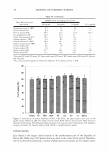
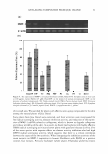
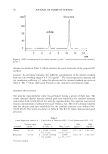
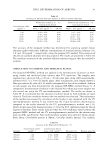
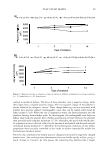
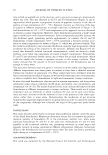
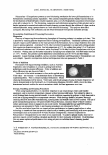
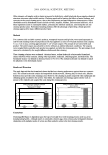
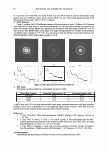
the highest sensitivity for arbutin. Second, among the mobile phases studied, a mixture
consisting of water:methanol:0.1 M hydrochloric acid (89: 10: 1, v/v/v) was used as the
mobile phase, and it was found that this mobile phase was the most suitable because it
resulted in good retention times, resolution, and satisfactory peak profiles (Figure 2).
Finally, the optimum flow rate was 1.0 ml/min-1, as it gave a good resolution, high
sensitivity, a short analysis time, etc. In the RP-HPLC analysis, arbutin and resorcinol
(internal standard) showed single symmetrical peaks (retention time 5. 7 min and 10. 7
min), respectively.
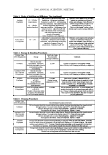
METHOD VALIDATION
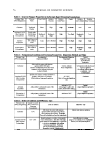
The proposed method was validated according to U.S. Pharmacopoeia USP (19).
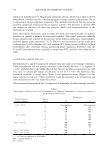
Sensitivity. The sensitivity of the assay was determined in terms of the detection limit
(LOD) and the quantitation limit (LOQ). Detection limits and quantitation limits were
estimated for each of the examined compounds. The values were calculated from the
standard deviation (S.D.) of response and the slope of the curve (S) by means of the
equations: LOD =3.3 (S.D./S) and LOQ =10 (S.D./S). Low LOD and LOQ values were
Mobile phase flow rate. The optimum flow rate of the mobile phase should provide good
separation, high sensitivity, and short analysis time. In this work, after the optimal
wavelength was selected, optimization of the flow rate was carried out by injecting the
same concentration of mixed standard solutions at varying flow rates from 0. 5 ml/min -l
to 1.0 ml/min- 1
.
Recommended RP-HPLC procedure. A sample and/or standard solution containing arbutin
was separated on a reverse-phase ODS Hypersil® C
18
column (125 mm x 4 mm, 5.0 µm)
and detected at 222 nm. An aliquot of 100 µl of a series of arbutin standard solutions
and 100 µl of sample extract was injected into the LC system and eluted with the mobile
phase, water:methanol:0.1 M hydrochloric acid (89: 10: 1, v/v/v) (flow rate =1.0 ml/
min- 1 ).The area of the arbutin peak was measured. Arbutin concentration in the plant
extract was determined by reference to the calibration curve prepared under identical
experimental conditions.
RESULTS AND DISCUSSION
A high-performance liquid chromatographic method for the determination of arbutin in
skin-whitening creams and medicinal plant extracts containing arbutin was developed.
The experimental conditions were investigated and the proposed method was also vali-
dated.
OPTIMIZATION OF RP-HPLC CONDITIONS
The optimal conditions of HPLC for determining arbutin were carried out under iso-
cratic conditions. Various mobile phase systems with different compositions were in-
vestigated. First, the optimal wavelength for the detection of arbutin and other com-
pounds, as mentioned earlier, was investigated, and the UV spectrum of each standard
compound showed the absorption maxima at 222 nm. A wavelength of 222 nm showed
the highest sensitivity for arbutin. Second, among the mobile phases studied, a mixture
consisting of water:methanol:0.1 M hydrochloric acid (89: 10: 1, v/v/v) was used as the
mobile phase, and it was found that this mobile phase was the most suitable because it
resulted in good retention times, resolution, and satisfactory peak profiles (Figure 2).
Finally, the optimum flow rate was 1.0 ml/min-1, as it gave a good resolution, high
sensitivity, a short analysis time, etc. In the RP-HPLC analysis, arbutin and resorcinol
(internal standard) showed single symmetrical peaks (retention time 5. 7 min and 10. 7
min), respectively.
METHOD VALIDATION
The proposed method was validated according to U.S. Pharmacopoeia USP (19).
Sensitivity. The sensitivity of the assay was determined in terms of the detection limit
(LOD) and the quantitation limit (LOQ). Detection limits and quantitation limits were
estimated for each of the examined compounds. The values were calculated from the
standard deviation (S.D.) of response and the slope of the curve (S) by means of the
equations: LOD =3.3 (S.D./S) and LOQ =10 (S.D./S). Low LOD and LOQ values were