HPLC DETERMINATION OF ARBUTIN 41
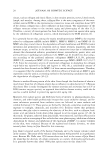
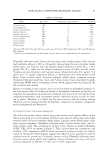
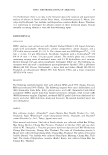
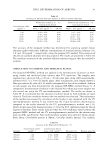
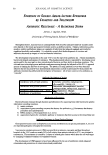
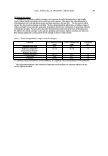
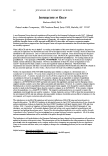
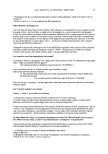
Table II
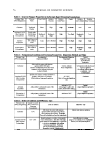
Intraday and Interday Precision Analysis of Arbutin Standard Solutions
Within-day variability (n =5)
(concentration found)
Between-day variability (n =5)
(concentration found)
Concentration added
(µg/ml- 1 )Mean ± S.D. (�1g/ml l) %R.S.D. Mean ± S.D. (µg/ml- 1 )%R.S.D.
1.00 0.99 ± 0.02
5.00 5.00 ± 0.02
10.00 10.09 ± 0.07
15.00 15.02 ± 0.08
20.00 19.88 ± 0.28
0.02
0.00
0.01
0.00
0.01
1.01 ± 0.02
5.00 ± 0.02
10.06 ± 0.11
15.02 ± 0.08
19.88 ± 0.28
0.02
0.00 o.cn
0.00
0.01
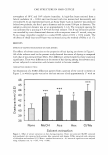
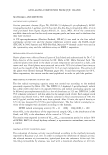
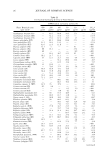
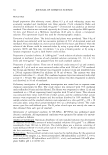
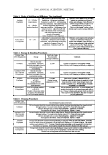
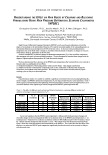
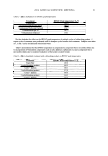
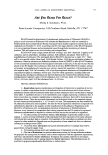
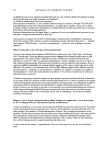
The accuracy of the proposed method was determined by analyzing sample extract
solutions spiked with three different concentrations of standard arbutin solution (3.0,
5 .0, and 10.0 µg/ml-1, respectively), using the proposed LC method. The recoveries of
the arbutin standard solutions were also analyzed. The results are presented in Table III.
The excellent recoveries of the standard addition amounts suggest that the method is
accurate.
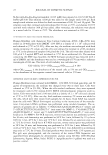
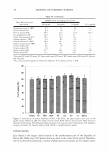
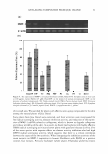
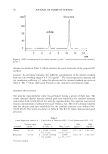
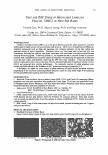
APPLICATION TO COSMETIC AND MEDICINAL PLANTS
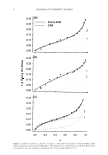
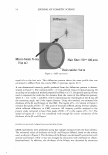
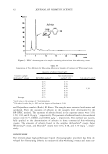
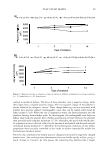
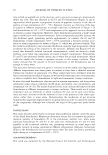
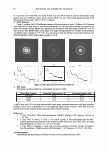
The proposed RP-HPLC method was applied to the determination of arbutin in whit-
ening creams and medicinal plant extracts after TLC extraction. The samples were
separated on a silica gel GF
254
(20 cm x 20 cm) glass plate using ethyl acetate:metha-
nol:water (85:17:13, v/v/v) as mobile phase. After visualization, each sample showed a
blue spot with an R
f value of 0.36, which corresponded to that of the standard. Arbutin
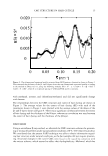
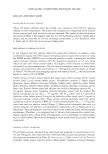
in each sample was then determined by the proposed RP-HPLC method (Figure 3). A
comparative determination of arbutin in the original skin-whitening cream samples was
also carried out using the UV spectrophotometric method. The results are shown in
Table IV. It is indicated that the amounts of arbutin found by both methods are quite
identical. Excellent correlation between the two methods was obtained. The performance
of the method was assessed by calculation of the Student t-test compared with the UV
spectrophotometric method. It was evident that the t-value for arbutin determination,
compared to the results obtained by the UV spectrophotometric method, was 1.38,
which did not exceed the theoretical value (2 .44) at the 95 %confidence limit for the six
degrees of freedom. These results indicated that the 95% confidence limit between the
proposed HPLC method and the UV spectrophotometric method for the arbutin assay
does not differ significantly. Four medicinal plant samples were collected: Betula alnoides
Buch. Ham, Clerodendrum petasites S. Moore., Curculigo latifolia Dryand. Var. latifolia,
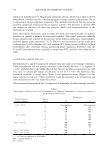
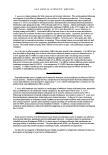
Table III
Accuracy of the Proposed LC Method (n =7)
Concentration added Concentration found:
Standard (µg/ml- 1
)mean ± S.D. (µg/ml- 1
)Recovery (%)Relative error (%)
Arbutin 3.00 2.96 ± 0.006 98.71 ± 0.22 0.04
.LA1rbu.tin 5.00 :
f\'.2 {\f\f\'.2 100.64 ± 0.06
.,I.VJ J... V,VVJ -\.I.VJf\'.2{\
Arbutin 10.00 10.15 ± 0.009 101.5 3 ± 0.09 -0.15
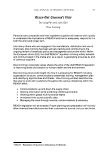
Table II
Intraday and Interday Precision Analysis of Arbutin Standard Solutions
Within-day variability (n =5)
(concentration found)
Between-day variability (n =5)
(concentration found)
Concentration added
(µg/ml- 1 )Mean ± S.D. (�1g/ml l) %R.S.D. Mean ± S.D. (µg/ml- 1 )%R.S.D.
1.00 0.99 ± 0.02
5.00 5.00 ± 0.02
10.00 10.09 ± 0.07
15.00 15.02 ± 0.08
20.00 19.88 ± 0.28
0.02
0.00
0.01
0.00
0.01
1.01 ± 0.02
5.00 ± 0.02
10.06 ± 0.11
15.02 ± 0.08
19.88 ± 0.28
0.02
0.00 o.cn
0.00
0.01
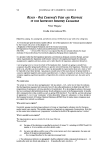
The accuracy of the proposed method was determined by analyzing sample extract
solutions spiked with three different concentrations of standard arbutin solution (3.0,
5 .0, and 10.0 µg/ml-1, respectively), using the proposed LC method. The recoveries of
the arbutin standard solutions were also analyzed. The results are presented in Table III.
The excellent recoveries of the standard addition amounts suggest that the method is
accurate.
APPLICATION TO COSMETIC AND MEDICINAL PLANTS
The proposed RP-HPLC method was applied to the determination of arbutin in whit-
ening creams and medicinal plant extracts after TLC extraction. The samples were
separated on a silica gel GF
254
(20 cm x 20 cm) glass plate using ethyl acetate:metha-
nol:water (85:17:13, v/v/v) as mobile phase. After visualization, each sample showed a
blue spot with an R
f value of 0.36, which corresponded to that of the standard. Arbutin
in each sample was then determined by the proposed RP-HPLC method (Figure 3). A
comparative determination of arbutin in the original skin-whitening cream samples was
also carried out using the UV spectrophotometric method. The results are shown in
Table IV. It is indicated that the amounts of arbutin found by both methods are quite
identical. Excellent correlation between the two methods was obtained. The performance
of the method was assessed by calculation of the Student t-test compared with the UV
spectrophotometric method. It was evident that the t-value for arbutin determination,
compared to the results obtained by the UV spectrophotometric method, was 1.38,
which did not exceed the theoretical value (2 .44) at the 95 %confidence limit for the six
degrees of freedom. These results indicated that the 95% confidence limit between the
proposed HPLC method and the UV spectrophotometric method for the arbutin assay
does not differ significantly. Four medicinal plant samples were collected: Betula alnoides
Buch. Ham, Clerodendrum petasites S. Moore., Curculigo latifolia Dryand. Var. latifolia,
Table III
Accuracy of the Proposed LC Method (n =7)
Concentration added Concentration found:
Standard (µg/ml- 1
)mean ± S.D. (µg/ml- 1
)Recovery (%)Relative error (%)
Arbutin 3.00 2.96 ± 0.006 98.71 ± 0.22 0.04
.LA1rbu.tin 5.00 :
f\'.2 {\f\f\'.2 100.64 ± 0.06
.,I.VJ J... V,VVJ -\.I.VJf\'.2{\
Arbutin 10.00 10.15 ± 0.009 101.5 3 ± 0.09 -0.15