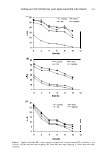
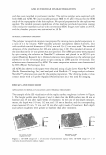
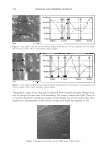
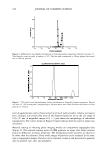
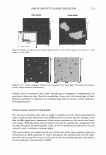
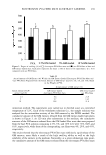
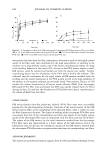
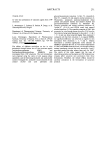
230 JOURNAL OF COSMETIC SCIENCE Particle helght(nm) Figure 6. AFM particle size (height) distribution of bi-modal polymer suspension. Particle size ratio 5:1. Total particle count included in analysis is 505. The first peak corresponds to 20-nm spheres, the second one to 100-nm particles. log differential hydrodynamic radius 2.5 Figure 7. DLS particle size (hydrodynamic radius) distribution of bi-modal polymer suspension. Particle size ratio 5:1. The second peak, corresponding to 100-µm radius, most likely indicates the presence of dust particles in solution. particle agglomerates can be characterized in terms of radius, height, volume, and aspect ratio. A larger scan reveals that most of the deposited particles are in the size range of 103-31 7 nm. A magnified image of (3 x 3 µm) shows the morphology of individual nanoparticles. The circles shown in Figure 8 (right) indicate how the particle radius was calculated. Material sensing or vibrating phase imaging modes can complement topography data (Figure 9). The material sensing mode of AFM produces an image that shows contrast based on differences in elastic properties. The foundation powder particles are shown to be softer than the substrate. Phase mode images of particles can be analyzed in the same way as topography images. Particles can be outlined, counted, and measured to generate data on particle size, area, and perimeter.

AFM IN PARTICLE CHARACTERIZATION 231 Particle Anal,- Particle Analylla Figure 8. Height distribution for foundation powder particles: 40 x 40 µm image is on the left 3 x 3 µm image is on the right. .. • • Figure 9. 20 x 20 µm topography (left-hand side) and phase mode (right-hand side) images of foundation powder. Images obtained simultaneously. Powder particle evaluation data show morphological parameters complemented by qualitative elasticity data. Particle morphology along with the knowledge of their physical parameters is important for manufacturing process control, surface chemistry, and agglomeration. CONCLUSIONS AND FUTURE WORK Pre- and post-treatment pilot data on surface roughness and line depth measurements from a single patient demonstrate that AFM may be utilized to measure changes in the skin to offer quantitative assessment of anti-aging treatments at the micron and nano scale ranges. AFM data from a future larger trial could be validated by comparison with existing descriptive and photographic scales, as well as profilometry techniques, that are currently used to evaluate cutaneous aging. The reported data on bi-modal particle size distribution of the aqua-polymer suspension demonstrate an AFM capability to resolve adequately the nominal peaks for the nano particles constituting the mixture. Individual as well as ensemble particle data analysis can be performed with the help of AFM.
Purchased for the exclusive use of nofirst nolast (unknown)
From: SCC Media Library & Resource Center (library.scconline.org)